
French Stocks Show Promising Technical Setup
Related content
Hungarian Equities - Technical Analysis
The BUX index may currently be in a corrective phase following its recent decline, with a retest of the latest swing low appearing more likely. MOL remains in a downtrend and could move lower if it breaks below its most recent swing low. Richter, however, has broken above its downtrend line, suggesting that a new upward wave may have started with the all-time high as a potential target. Magyar Telekom also broke higher two weeks ago, and the uptrend remains intact. Opus is still trading in a downtrend, with no convincing signs of a reversal yet. Rába continued to move within its narrowing range, and under the right conditions, another upward wave could emerge later on.
International Markets - Technical Analysis
The two leading U.S. indices have broken their upward trend that had lasted for months, so from a technical perspective, a downward trend remains visible. There is still room for prices to fall, so opening long positions seems early at this point. The Russell 2000 had already signaled significant weakness earlier. Although some buying pressure is currently observable, which could lead to a corrective rally, this appears to be more of a temporary rebound than the start of a sustained uptrend. Following their corrections, the DAX and Stoxx 600 indices also appear to be turning downward again, so the formation of new swing lows cannot be ruled out for them either. The index tracking emerging markets has not yet been able to demonstrate any significant buying momentum, so there is still some room here for further weakness.
The European markets continue to be characterized by choppy price action, with two days of gains often followed by two days of declines, reflecting the prevailing uncertainty among investors. Some sector rotation can be observed away from the previously market-leading technology sector and into other areas of the market. While attractive stock opportunities can still be found, we remain sceptical that a sustained momentum-driven move can develop in the current environment. As a result, strong directional trends appear unlikely for the time being. In such conditions, pullbacks and retests are likely to provide more favourable entry opportunities. This week, we highlight two French stocks from our screen.
Best rated European stocks based on momentum ranking
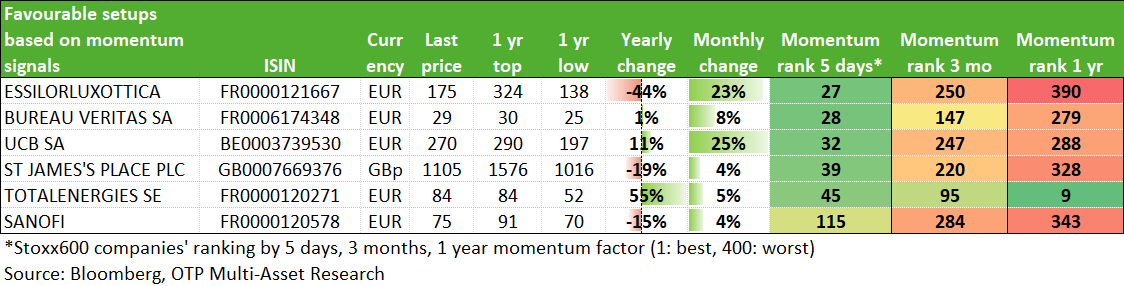
Compelling technical picture:
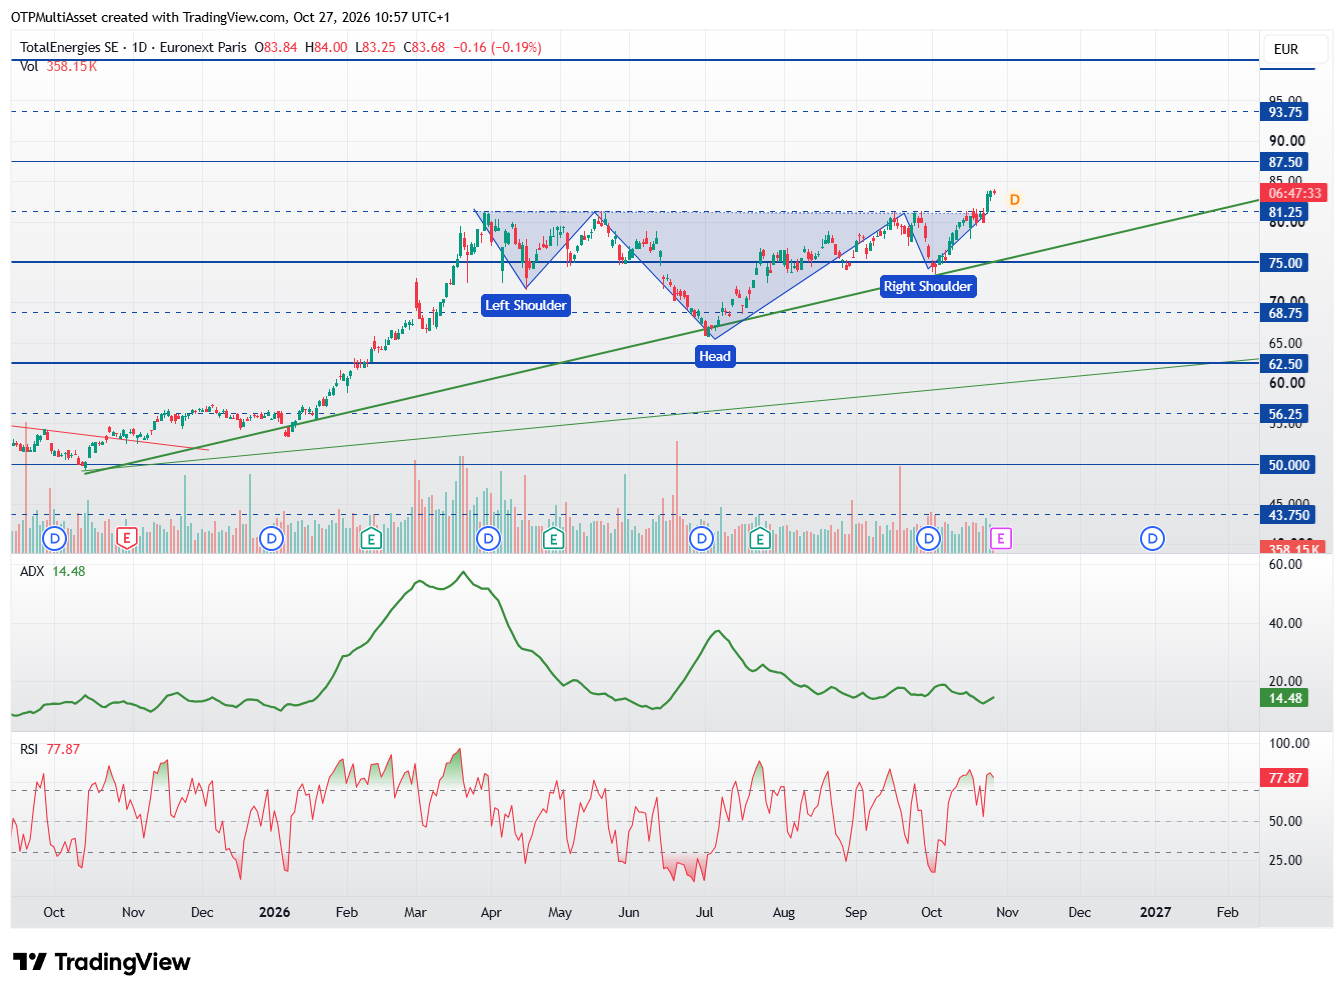
Totalenergies (daily): It has been forming a bullish continuation pattern over the past few months, from which it recently broke to the upside. The breakout was confirmed by a move above the ideal rising green trendline and the €81.25 level. Based on the continuation pattern, the price target points to around €100, although a move toward the natural resistance level at €93.75 would already be consistent with the setup. Initially, risk could be managed with a stop below €75 on a closing basis, while this threshold would gradually rise alongside the trendline over time.
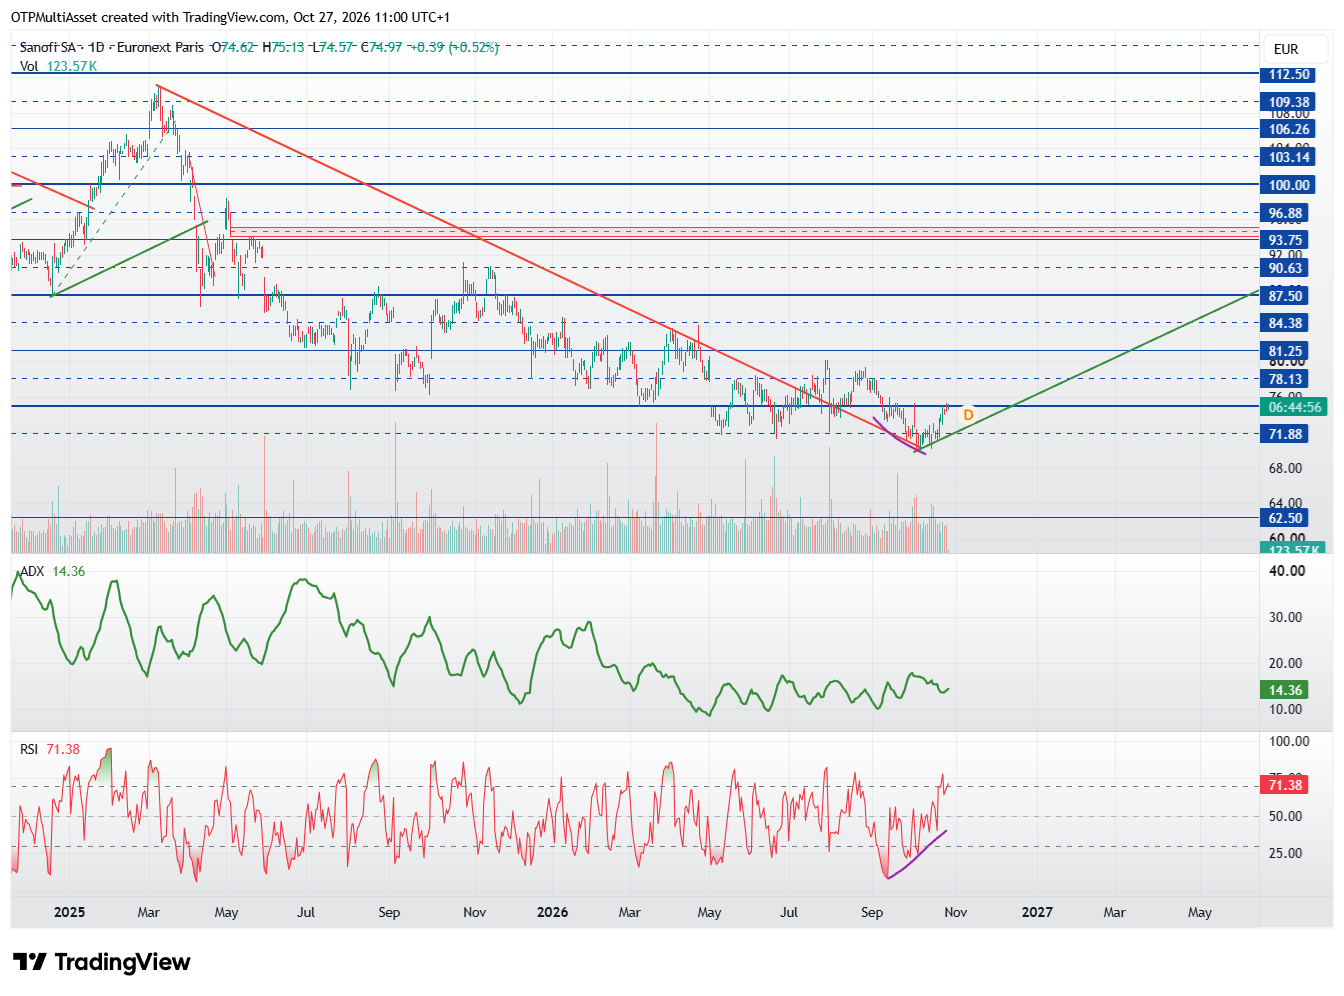
Sanofi (daily): This chart does not yet present a textbook reversal setup, but it is trading in an area where selling pressure appears to be fading. At the same time, the share price has reached the €75 region, which had long been identified as an important support level. The long-standing downtrend has been broken, increasing the likelihood that a corrective recovery phase could begin. That said, the current pattern does not yet suggest a rapid advance. A higher low would still need to form to confirm a more complete reversal structure. However, if the stock can hold above the rising green trendline for the next several weeks, the foundation could be laid for a more meaningful upside correction.
List of stocks with a chance of a turnaround in the coming weeks

Most popular European stocks
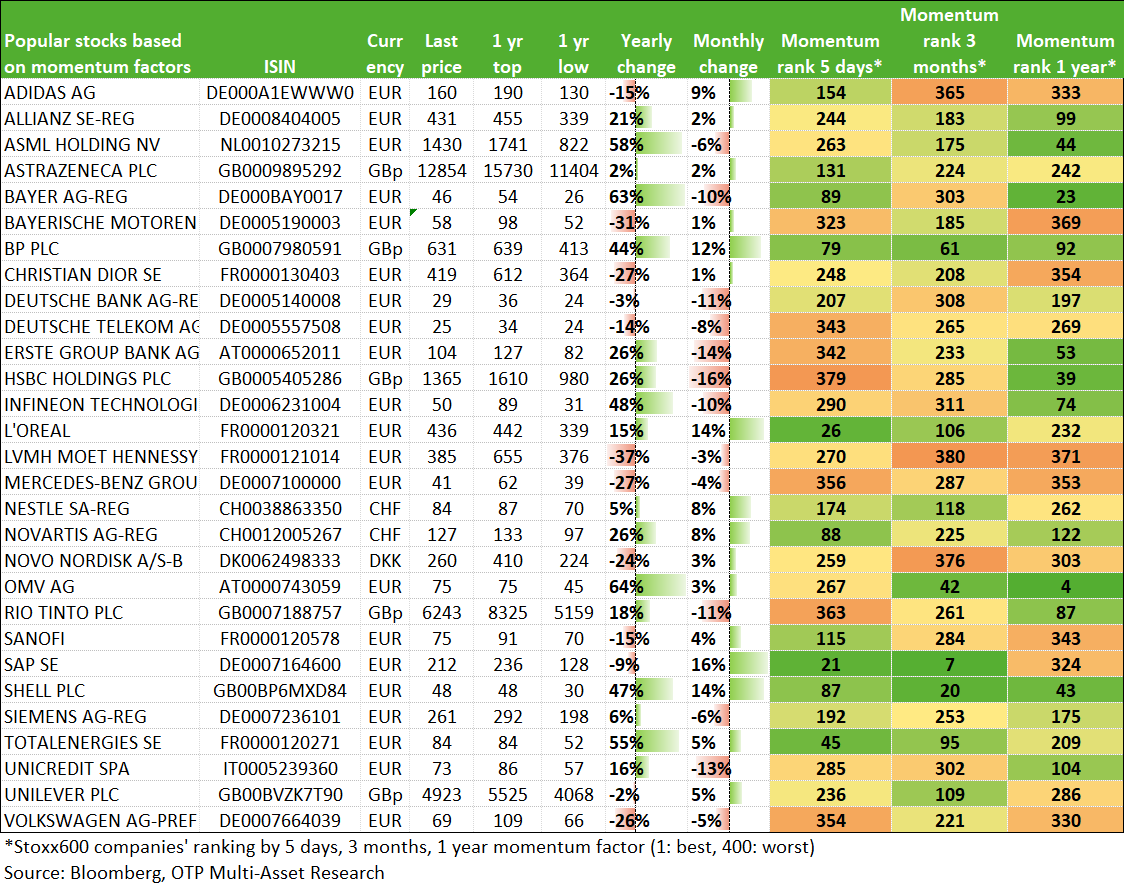
The momentum model supports the creation of a technical based stock list that helps to find shorter-term trading opportunities. The model can be used to identify stocks that show reversal signals following more sustained falls/underperformance. We examine one-year, six-month, three-month, one-month and five-day momentum values, which are used to rank the stocks under consideration. The higher a stock is ranked in the order, the better it technically performs relative to the others. The change in the ranking over time is used to determine the life cycle of the stock.
- In the first table, we collect the stocks that show the most attractive picture compared to the others in a given week based on momentum factors, of which those are also presented in a separate chart where a favourable situation can be identified based on additional technical analysis tools.
- In the second table, we list the stocks that are already worthy of being placed in watchlist status. They are not among the best performers, but they have the potential to improve and signal a turnaround in a few days or weeks.
- In the third table, we have also collected the more popular stocks to help identify their position in the momentum order.
The report shows the results of a technical - quantitative based stock screening, which does not examine the fundamental background/value of the companies. For this reason, risk management/position sizing rules should be designed accordingly.
Get more out of your investments!
Global Markets Services
OTP Global Markets offers a broad range of services in the field of local and international money and capital markets.
Read morePrivate Banking Services
Personal care and expertise with OTP Private Banking, along with the knowledge, security, and innovations of a multinational banking group.
Read more