
The chart of the American chipmaker looks promising
Related content
Meta: Burning Cash on the AI Promise
Overall, Meta’s quarterly performance continues to paint a positive picture in terms of the underlying fundamentals, while the company has also achieved significant milestones on the AI model development front. However, elevated spending is taking a substantial bite out of cash generation, with free cash flow now turning negative, which may increasingly require funding through capital market financing. Following the stock’s rally in recent weeks, valuation levels have also moved higher. In the near term, these factors may continue to put pressure on the stock, although the longer-term outlook remains constructive. Naturally, much will depend on the company’s ability to effectively monetize its investment program over time.
The government plans a 4.9% deficit for next year
The government plans a 4.9% deficit for next year and will gradually reach 2.8% by 2030, under the Maastricht criteria
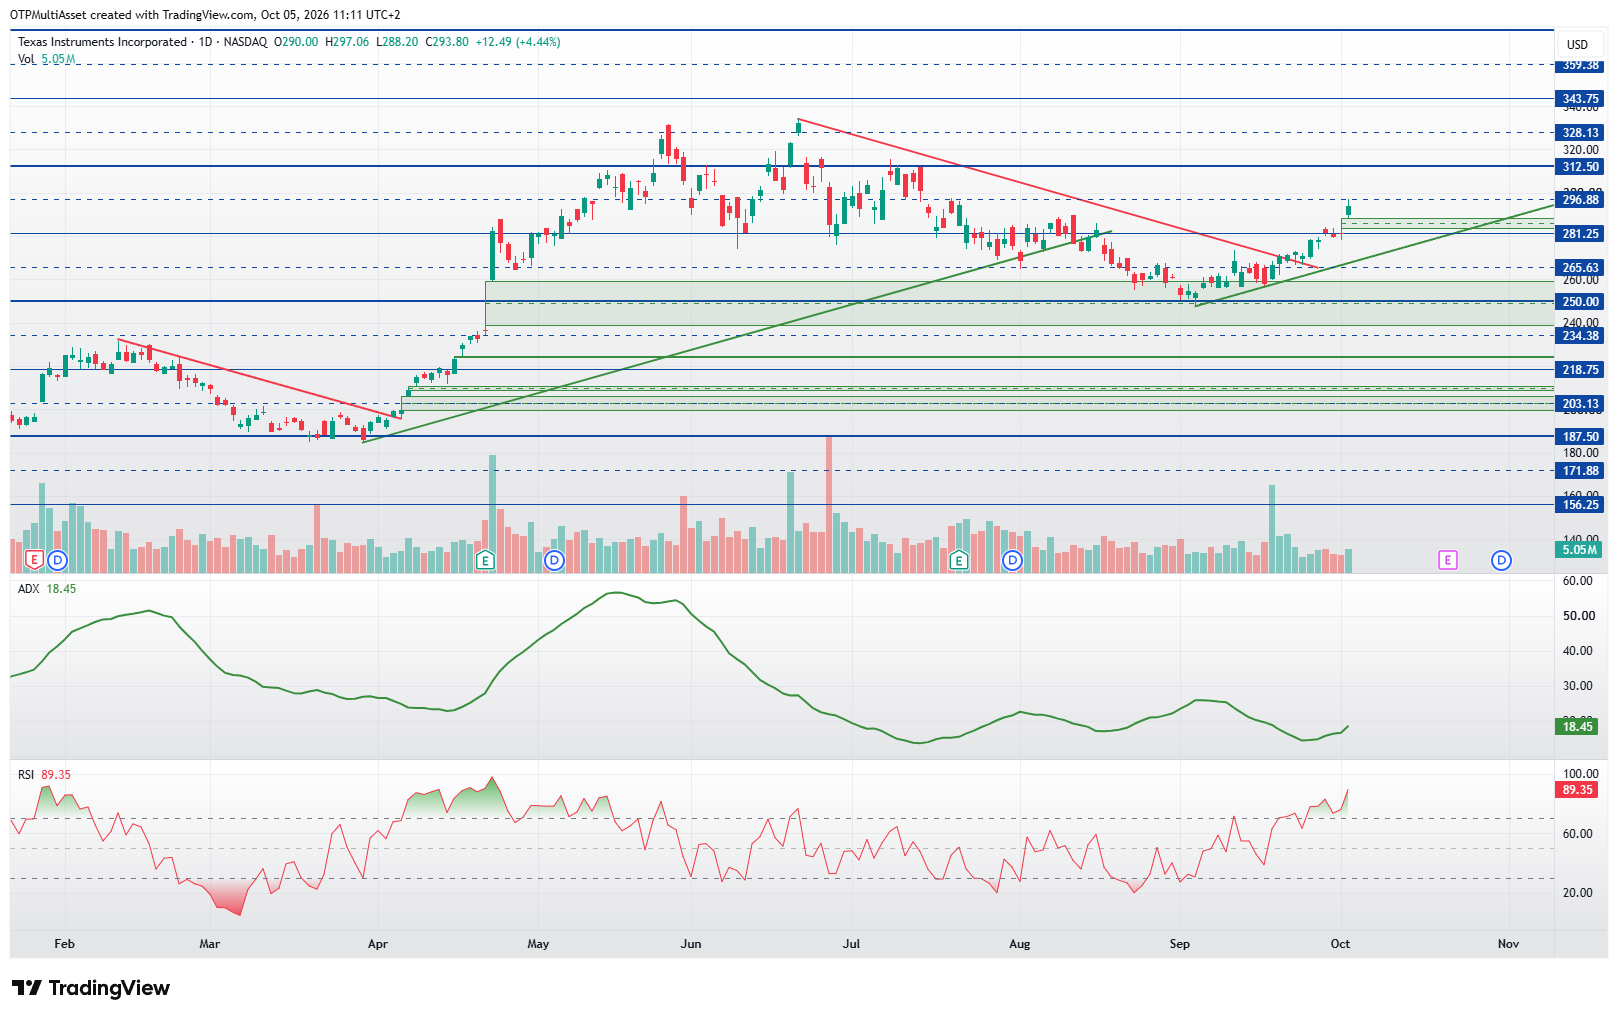
The major U.S. stock indices are trading near their all-time highs, so truly attractive investment opportunities remain scarce. At present, only the technology sector is generating positive signals based on momentum indicators. Most other sectors continue to underperform, lacking strength and exhibiting corrective price action. In such an environment, strict risk management remains essential, even for stocks within sectors that still show potential. In today's analysis, we take a closer look at shares of the semiconductor company Texas Instruments.
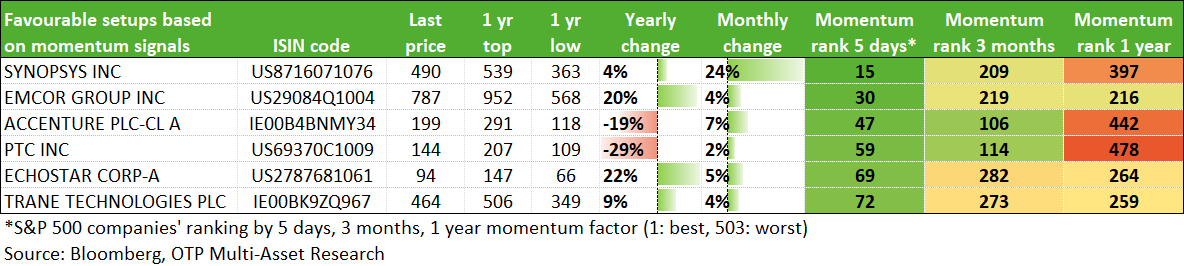
Best rated US stocks based on momentum ranking
Compelling technical picture:
Texas Instruments (Daily Chart):
Following a three-month correction, the stock resumed its upward move last week. On Friday, it also opened with a bullish gap. A break below the 250 level could serve as a risk management threshold, while the upside remains open toward new all-time highs. The target zone can be identified between 343 and 375 per share.
List of stocks with a chance of a turnaround in the coming weeks

Most popular US stocks
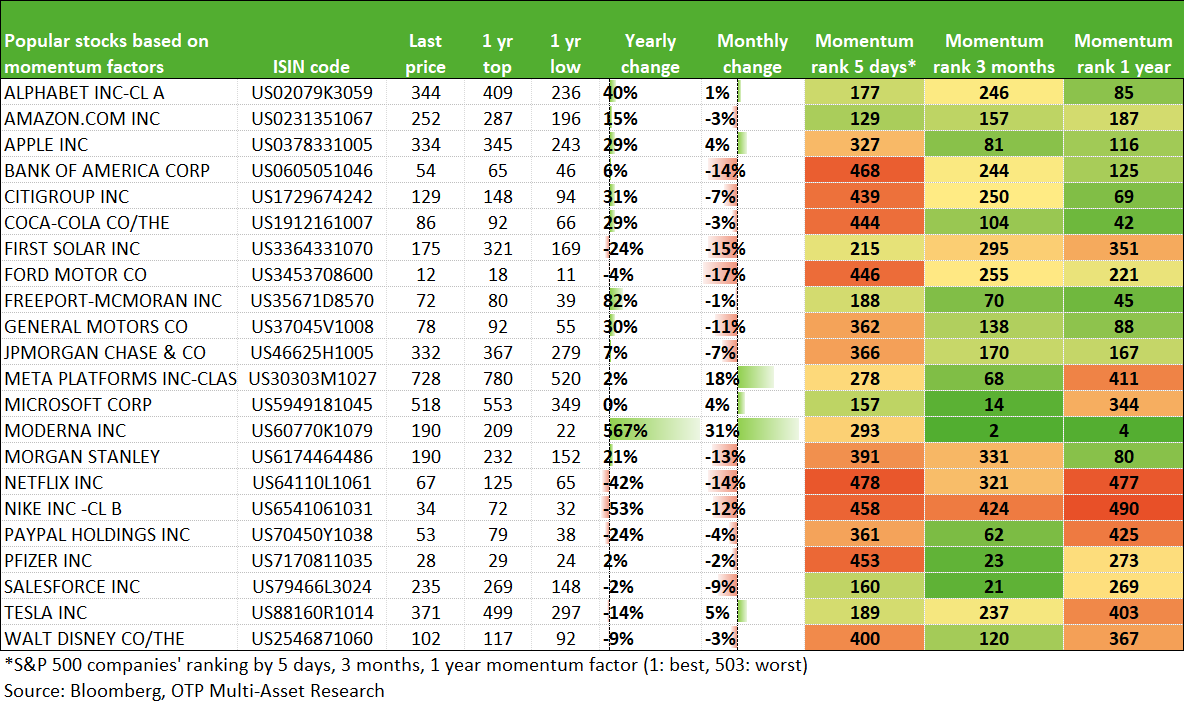
The momentum model supports the creation of a technical based stock list that helps to find shorter-term trading opportunities. The model can be used to identify stocks that show reversal signals following more sustained falls/underperformance. We examine one-year, six-month, three-month, one-month and five-day momentum values, which are used to rank the stocks under consideration. The higher a stock is ranked in the order, the better it technically performs relative to the others. The change in the ranking over time is used to determine the life cycle of the stock.
- In the first table, we collect the stocks that show the most attractive picture compared to the others in a given week based on momentum factors, of which those are also presented in a separate chart where a favourable situation can be identified based on additional technical analysis tools.
- In the second table, we list the stocks that are already worthy of being placed in watchlist status. They are not among the best performers, but they have the potential to improve and signal a turnaround in a few days or weeks.
- In the third table, we have also collected the more popular stocks to help identify their position in the momentum order.
The report shows the results of a technical - quantitative based stock screening, which does not examine the fundamental background/value of the companies. For this reason, risk management/position sizing rules should be designed accordingly.
Get more out of your investments!
Global Markets Services
OTP Global Markets offers a broad range of services in the field of local and international money and capital markets.
Read morePrivate Banking Services
Personal care and expertise with OTP Private Banking, along with the knowledge, security, and innovations of a multinational banking group.
Read more