
Ford and Mosaic Are Showing Signs of a Turnaround
Related content
The U.S. Market Offers Fewer Compelling Buying Opportunities
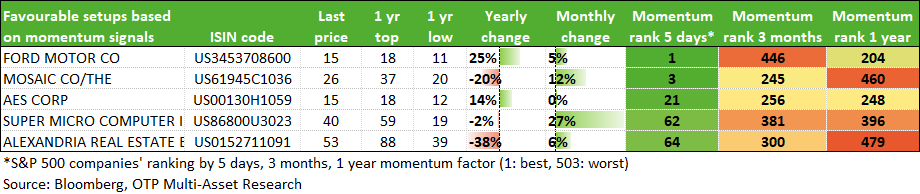
The major U.S. indices turned lower last week, with key trendlines also coming under pressure. In such an environment, momentum is clearly favoring the sellers, making it difficult to identify attractive buying opportunities for the time being. The key question, of course, remains whether we are witnessing the beginning of a lasting trend reversal or merely a short-lived yet sharp correction. Accordingly, although a few stocks met the predefined screening criteria this week, none of them offered a particularly compelling entry point.
International Markets - Technical Analysis
Among U.S. indices, both the S&P 500 and the Nasdaq have broken their upward trends,which had been lasting for months. There is room for a correction, so it may only be worth buying well below current levels. The Russell 2000 began its decline earlier and has continued to fall since then. The DAX and the Stoxx 600, on the other hand, are showing some reversal from their strong support levels, but this appears to be more of a correction. The index tracking emerging markets has also broken below the lower boundary of its trading range and has begun a trend-like decline.
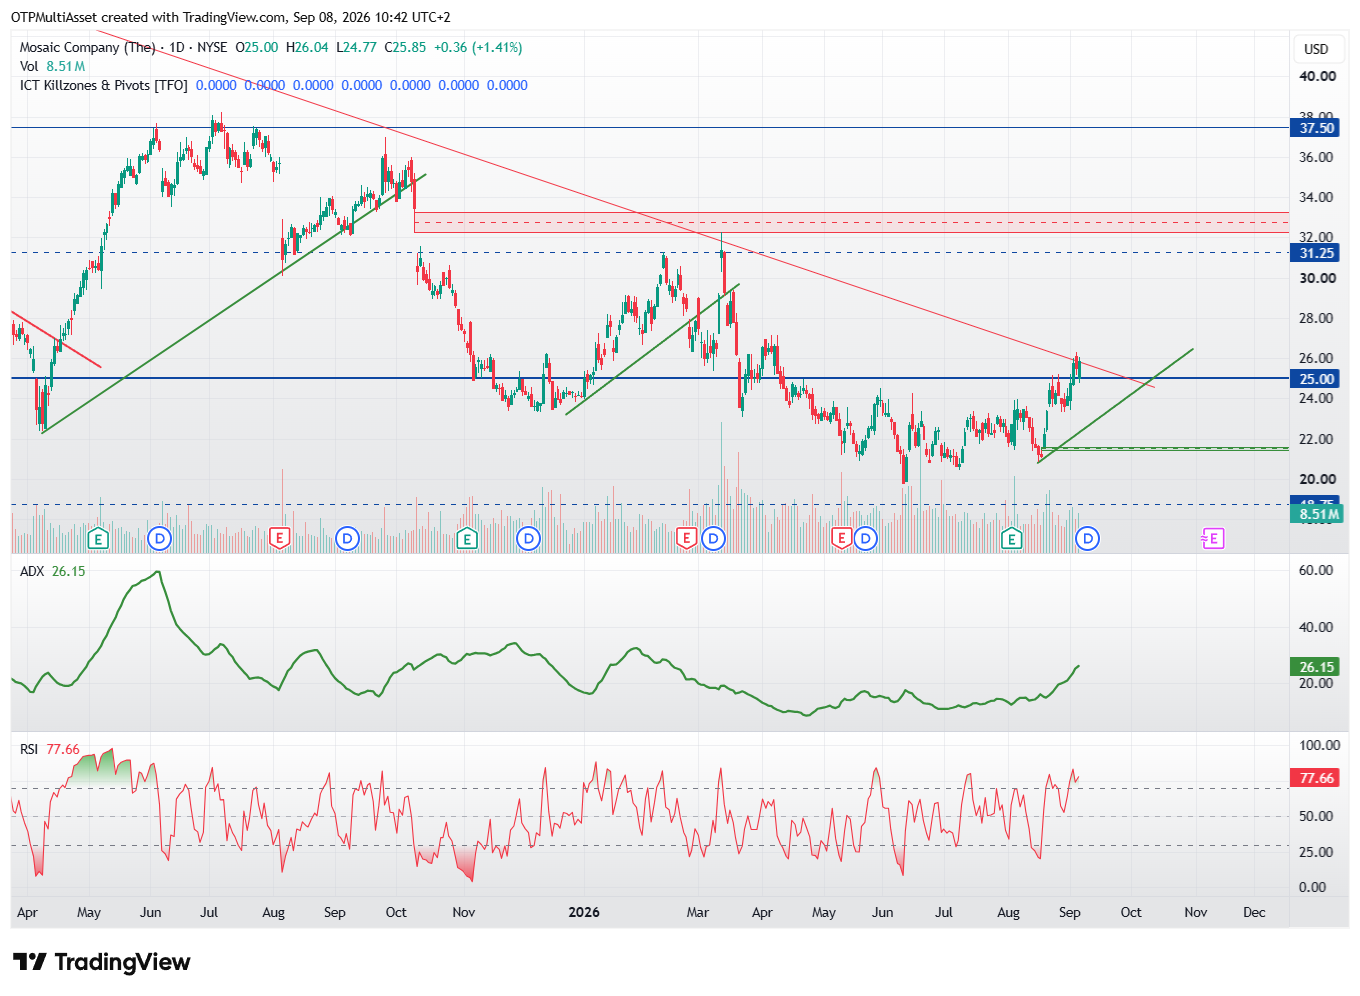
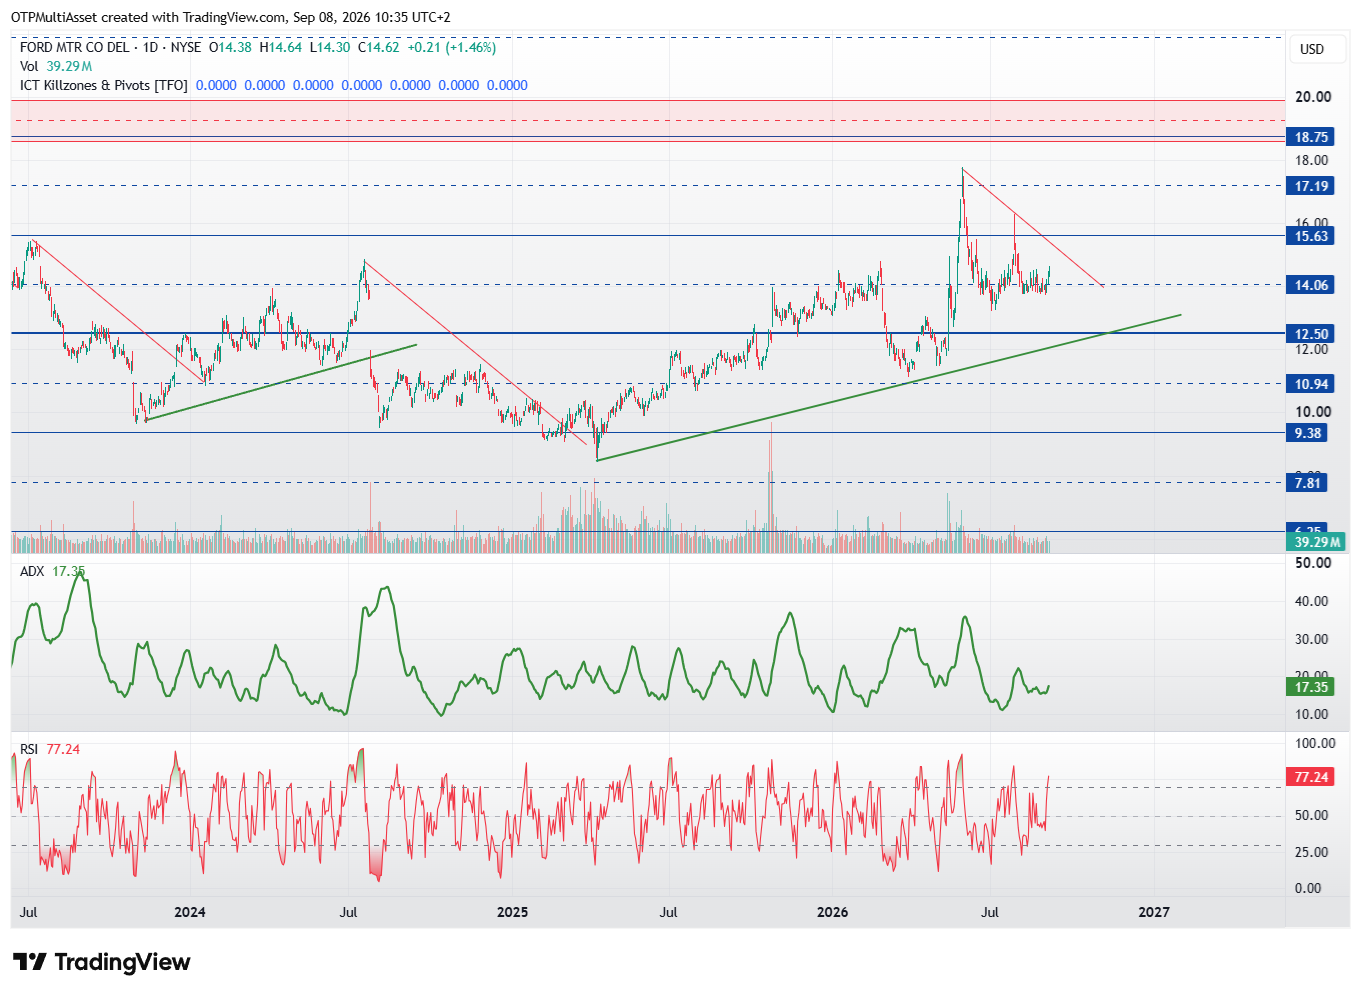
U.S. markets remain stretched, so the number of momentum-based trading opportunities has declined significantly. As a result, it is becoming increasingly difficult to find high-quality stocks poised for an uptrend. Today’s analysis once again features Mosaic, one of the world’s largest fertilizer manufacturers, and Ford Motor Company. We recommended Mosaic stock two weeks ago, but at that time we made the buy recommendation contingent on certain conditions being met. Those conditions have since been met, so it’s worth keeping a close eye on the stock and looking for entry opportunities. In the case of Ford, further confirmation is needed; however, the current risk-reward ratio appears favorable, so this stock may also be added to the list of long-term investment opportunities.
Best rated US stocks based on momentum ranking
Compelling technical picture:
Mosaic (daily): Even though this stock had already been one of the selections on the momentum-based screening list two weeks ago, it has now secured an even higher position. It managed to break above the 25 level and then retest it. We’re seeing days of accumulation, and sentiment surrounding the stock is shifting. This chart remains suitable for buying on dips. The minimum expected target price is around 31.25, but it could even go higher later on.
Ford (daily): Automotive stocks aren’t the most popular these days, yet this chart tells a different story. To begin with, the overall trend has been upward since early 2025. Within this uptrend, the target price was at least around 18.75, a level it has not yet reached. After two rallies in recent weeks, its trading range has narrowed significantly, and it is now attempting to break out upward again from this range. Risk can be managed by a close below 12.5, while the target price, upon a break above the red trendline, points to at least the aforementioned 18.75 area, where a gap awaits filling.
List of stocks with a chance of a turnaround in the coming weeks

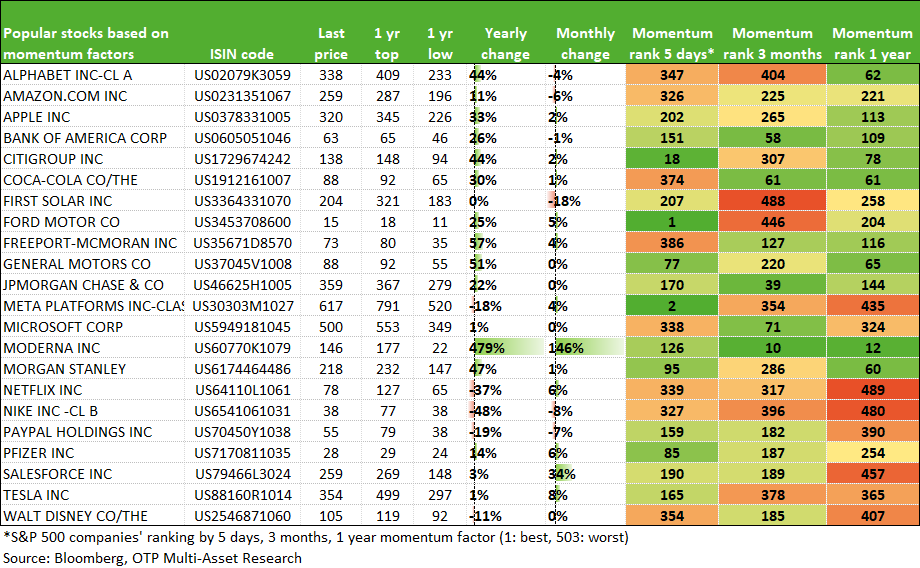
Most popular US stocks
The momentum model supports the creation of a technical based stock list that helps to find shorter-term trading opportunities. The model can be used to identify stocks that show reversal signals following more sustained falls/underperformance. We examine one-year, six-month, three-month, one-month and five-day momentum values, which are used to rank the stocks under consideration. The higher a stock is ranked in the order, the better it technically performs relative to the others. The change in the ranking over time is used to determine the life cycle of the stock.
- In the first table, we collect the stocks that show the most attractive picture compared to the others in a given week based on momentum factors, of which those are also presented in a separate chart where a favourable situation can be identified based on additional technical analysis tools.
- In the second table, we list the stocks that are already worthy of being placed in watchlist status. They are not among the best performers, but they have the potential to improve and signal a turnaround in a few days or weeks.
- In the third table, we have also collected the more popular stocks to help identify their position in the momentum order.
The report shows the results of a technical - quantitative based stock screening, which does not examine the fundamental background/value of the companies. For this reason, risk management/position sizing rules should be designed accordingly.
Get more out of your investments!
Global Markets Services
OTP Global Markets offers a broad range of services in the field of local and international money and capital markets.
Read morePrivate Banking Services
Personal care and expertise with OTP Private Banking, along with the knowledge, security, and innovations of a multinational banking group.
Read more