S&P500
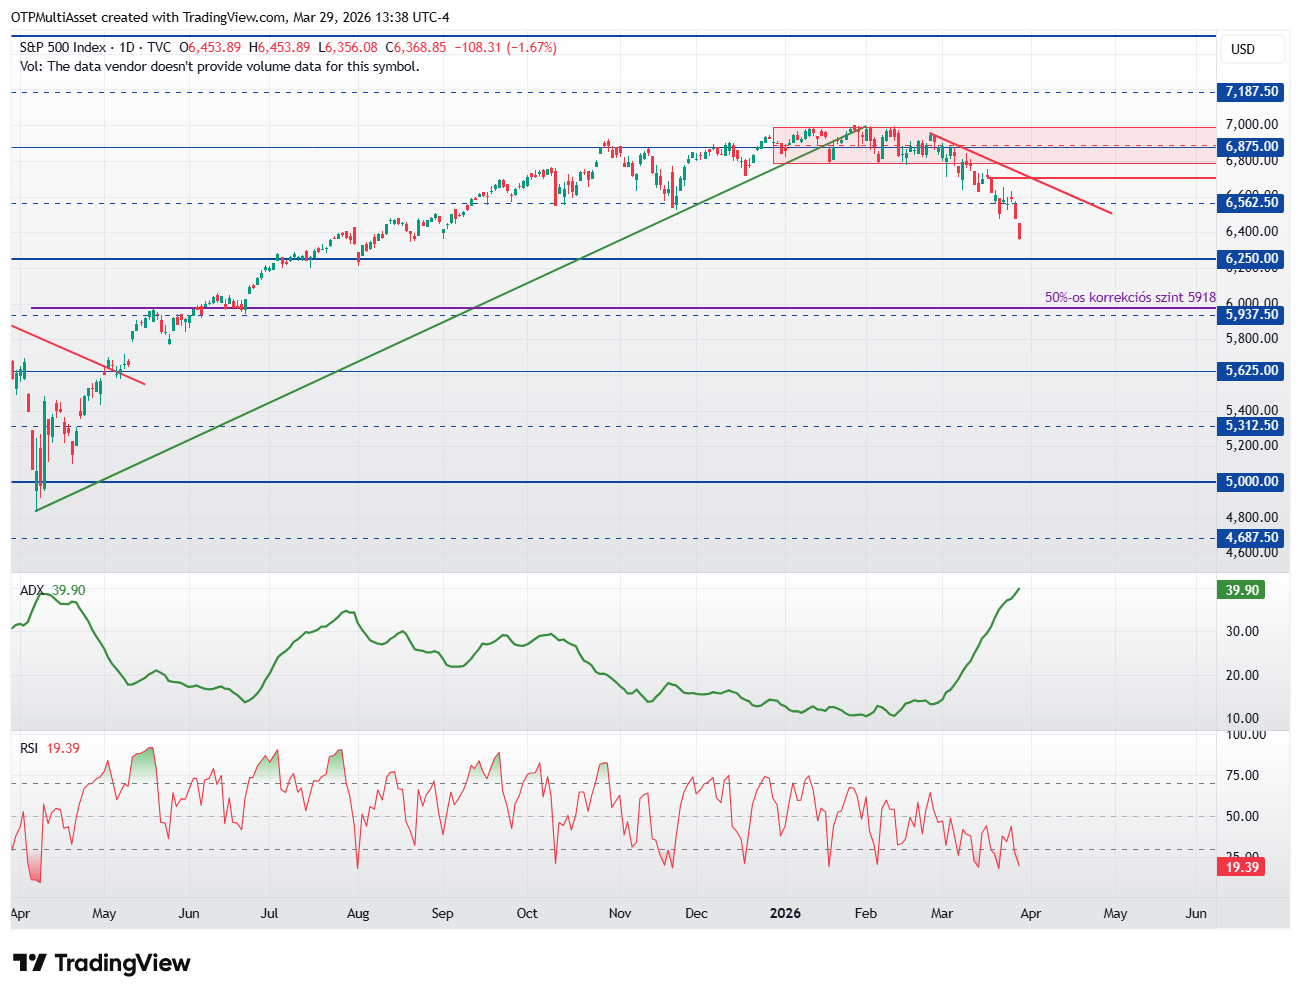
In the second half of the week, the index began to fall more sharply. The main trend is downward, with the thick red trend line being the dominant factor. It also left a gap on the downside, which is another negative sign for the medium term. It is worth looking at the curve from a broader perspective over a longer time frame and identifying the correction levels of the one-year-long uptrend, based on which a 50% correction (5,918) would be the minimum expected from the decline. The ideal correction (61.8%) is around 5,625. A new long wave could start above the red trend line, which is not currently the case. If the downtrend continues, a correction could come sooner without breaking the downward trend. The curve is slightly oversold, and in recent weeks we’ve seen upward movement on Mondays, but no movement suggesting a sustained reversal. Going long should only be considered in the short term, with very strict risk management, and essentially only for intraday positions; however, it’s better to be patient and wait for the aforementioned levels to be tested.
Resistance levels: 7,188; 7,500.
Support levels: 6,250; 5,937; 5,781; 5,625.