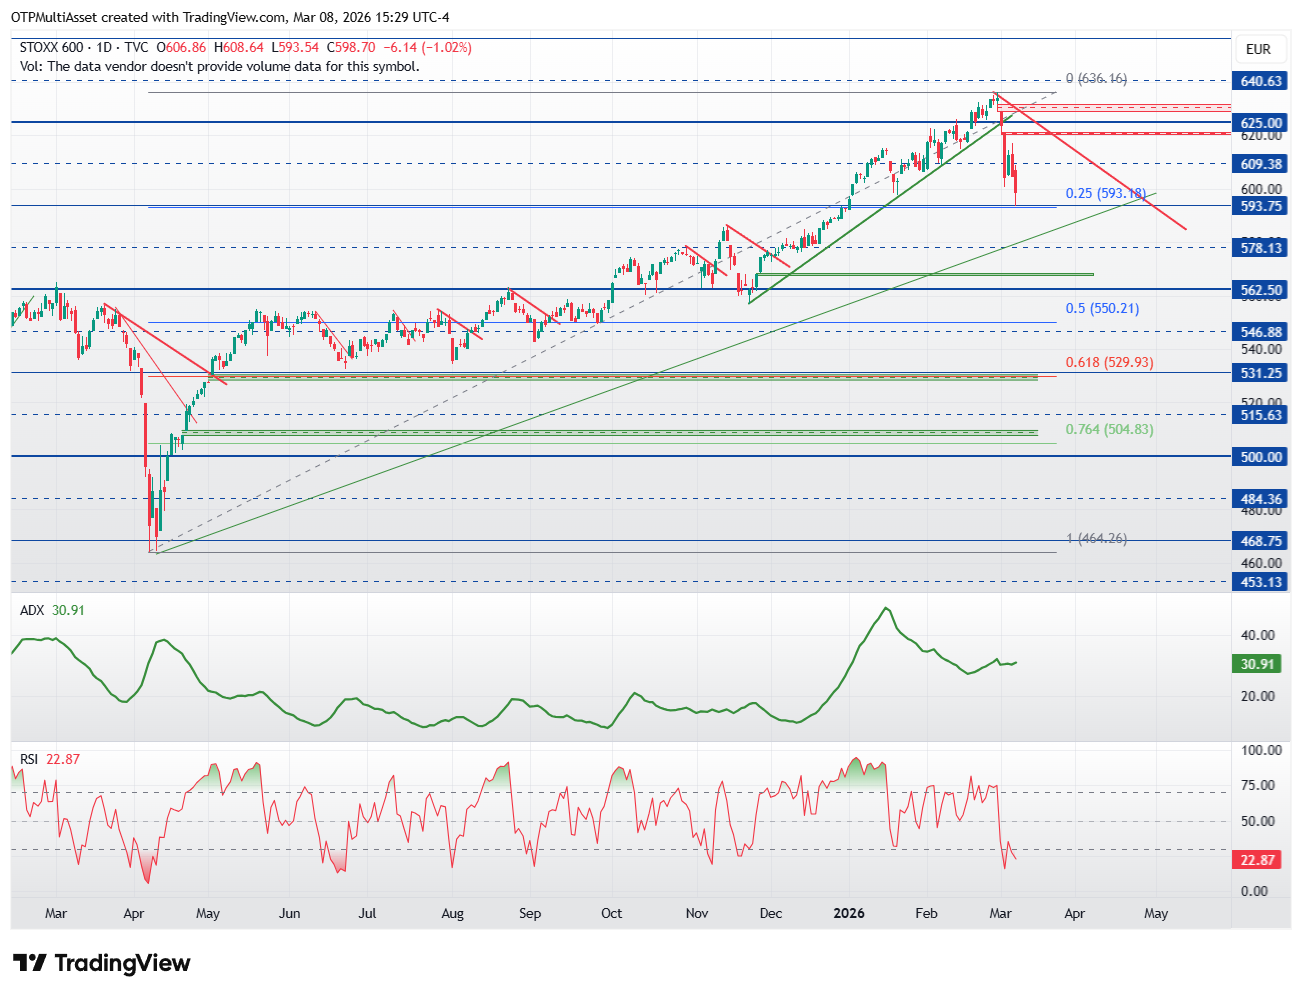
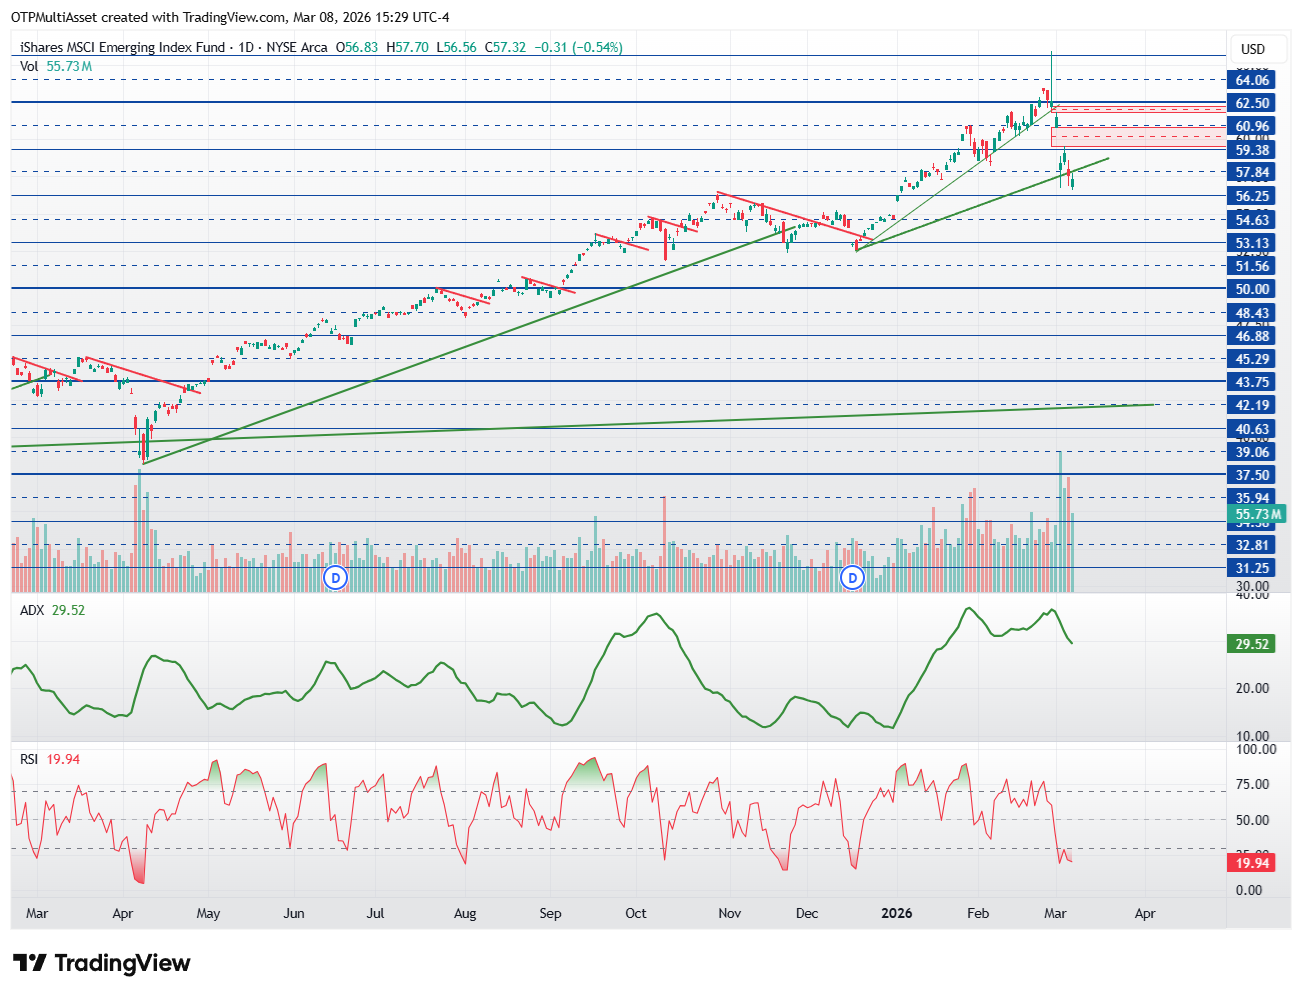
S&P500
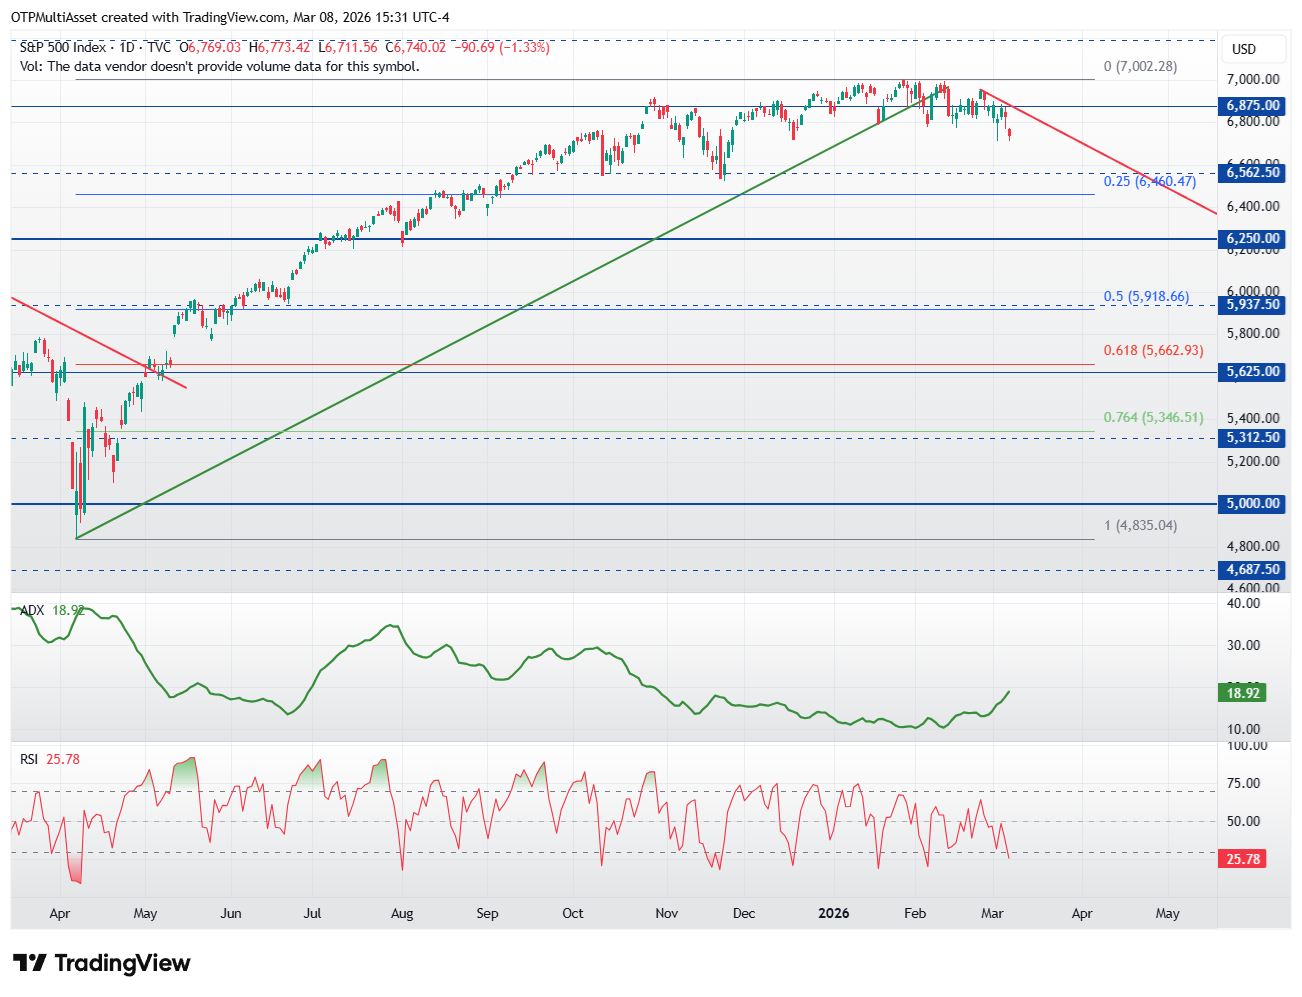
By Friday, the technical picture for the decline had come together. The support level was at 6,780, below which there was room for downward movement. It closed below this level, thus ending the several weeks of consolidation. The trend is downward, and the movement shows a trend-like decline. If the index leaves a gap down today and it is not filled by Tuesday, this could be a very strong signal for a further decline. In this case, the correction levels of the year-long upward phase can be taken into account, based on which a minimum 50% correction could be expected from the fall. This support level is around 5,937. The ideal correction (61.8%) is around 5,625. A new long wave may start above the red trend line, which is not currently the case, but if there is a very strong break, this could of course bring a correction sooner. Currently, long entry is not supported.
Resistance levels: 7,188; 7,500.
Support levels: 6,563; 6,250; 5,937; 5,781; 5,625.