
Hungary: Despite the lower-than-expected headline inflation data the picture is not as rosy as it first appears
Related content
Commodities - Technical Analysis
Gold and silver continued their correction and even dropped below key support levels, so it’s best to postpone buying for now. The price of oil has narrowed significantly between the $87.50 level and the trend line, so any significant movement will likely require a breakout from this zone. Natural gas has retested its uptrend line, but buyers continue to show strength.Copper appears to be developing a broader trading range, making oversold and overbought zones potentially more attractive for trading opportunities. Wheat and corn continue to trade in a correction phase, while moving closer and closer to their key support levels.
FX - Technical Analysis
The dollar has reached key support levels against both the euro and the pound, where some buying interest has already emerged. As a result, the charts are increasingly pointing to the possibility of a corrective rebound. On a broader timeframe, however, there are still no clear signs of a sustained weakening trend in the dollar. Following a period of weak performance, the forint has reached a resistance zone, where buying activity is once again evident against its major currency pairs; thus, a sideways, range-bound movement still appears likely. Although the USD/JPY exchange rate managed to rise, it continues to trade within a downtrend, so a trend reversal is still some time away. For this to happen, it is important that the exchange rate does not hit a new low. Following its rise, the EUR/CHF is undergoing a strong retest, so its long-term uptrend may now depend on key levels.
Hungary's headline inflation increased to 1.6% year-on-year in September from 1.3% in August. The published data was lower than the consensus and our forecast (both 1.8%). The lower-than-expected inflation was due to above expectation core inflation but a bigger than expected decline in food prices and a decrease in administered prices.
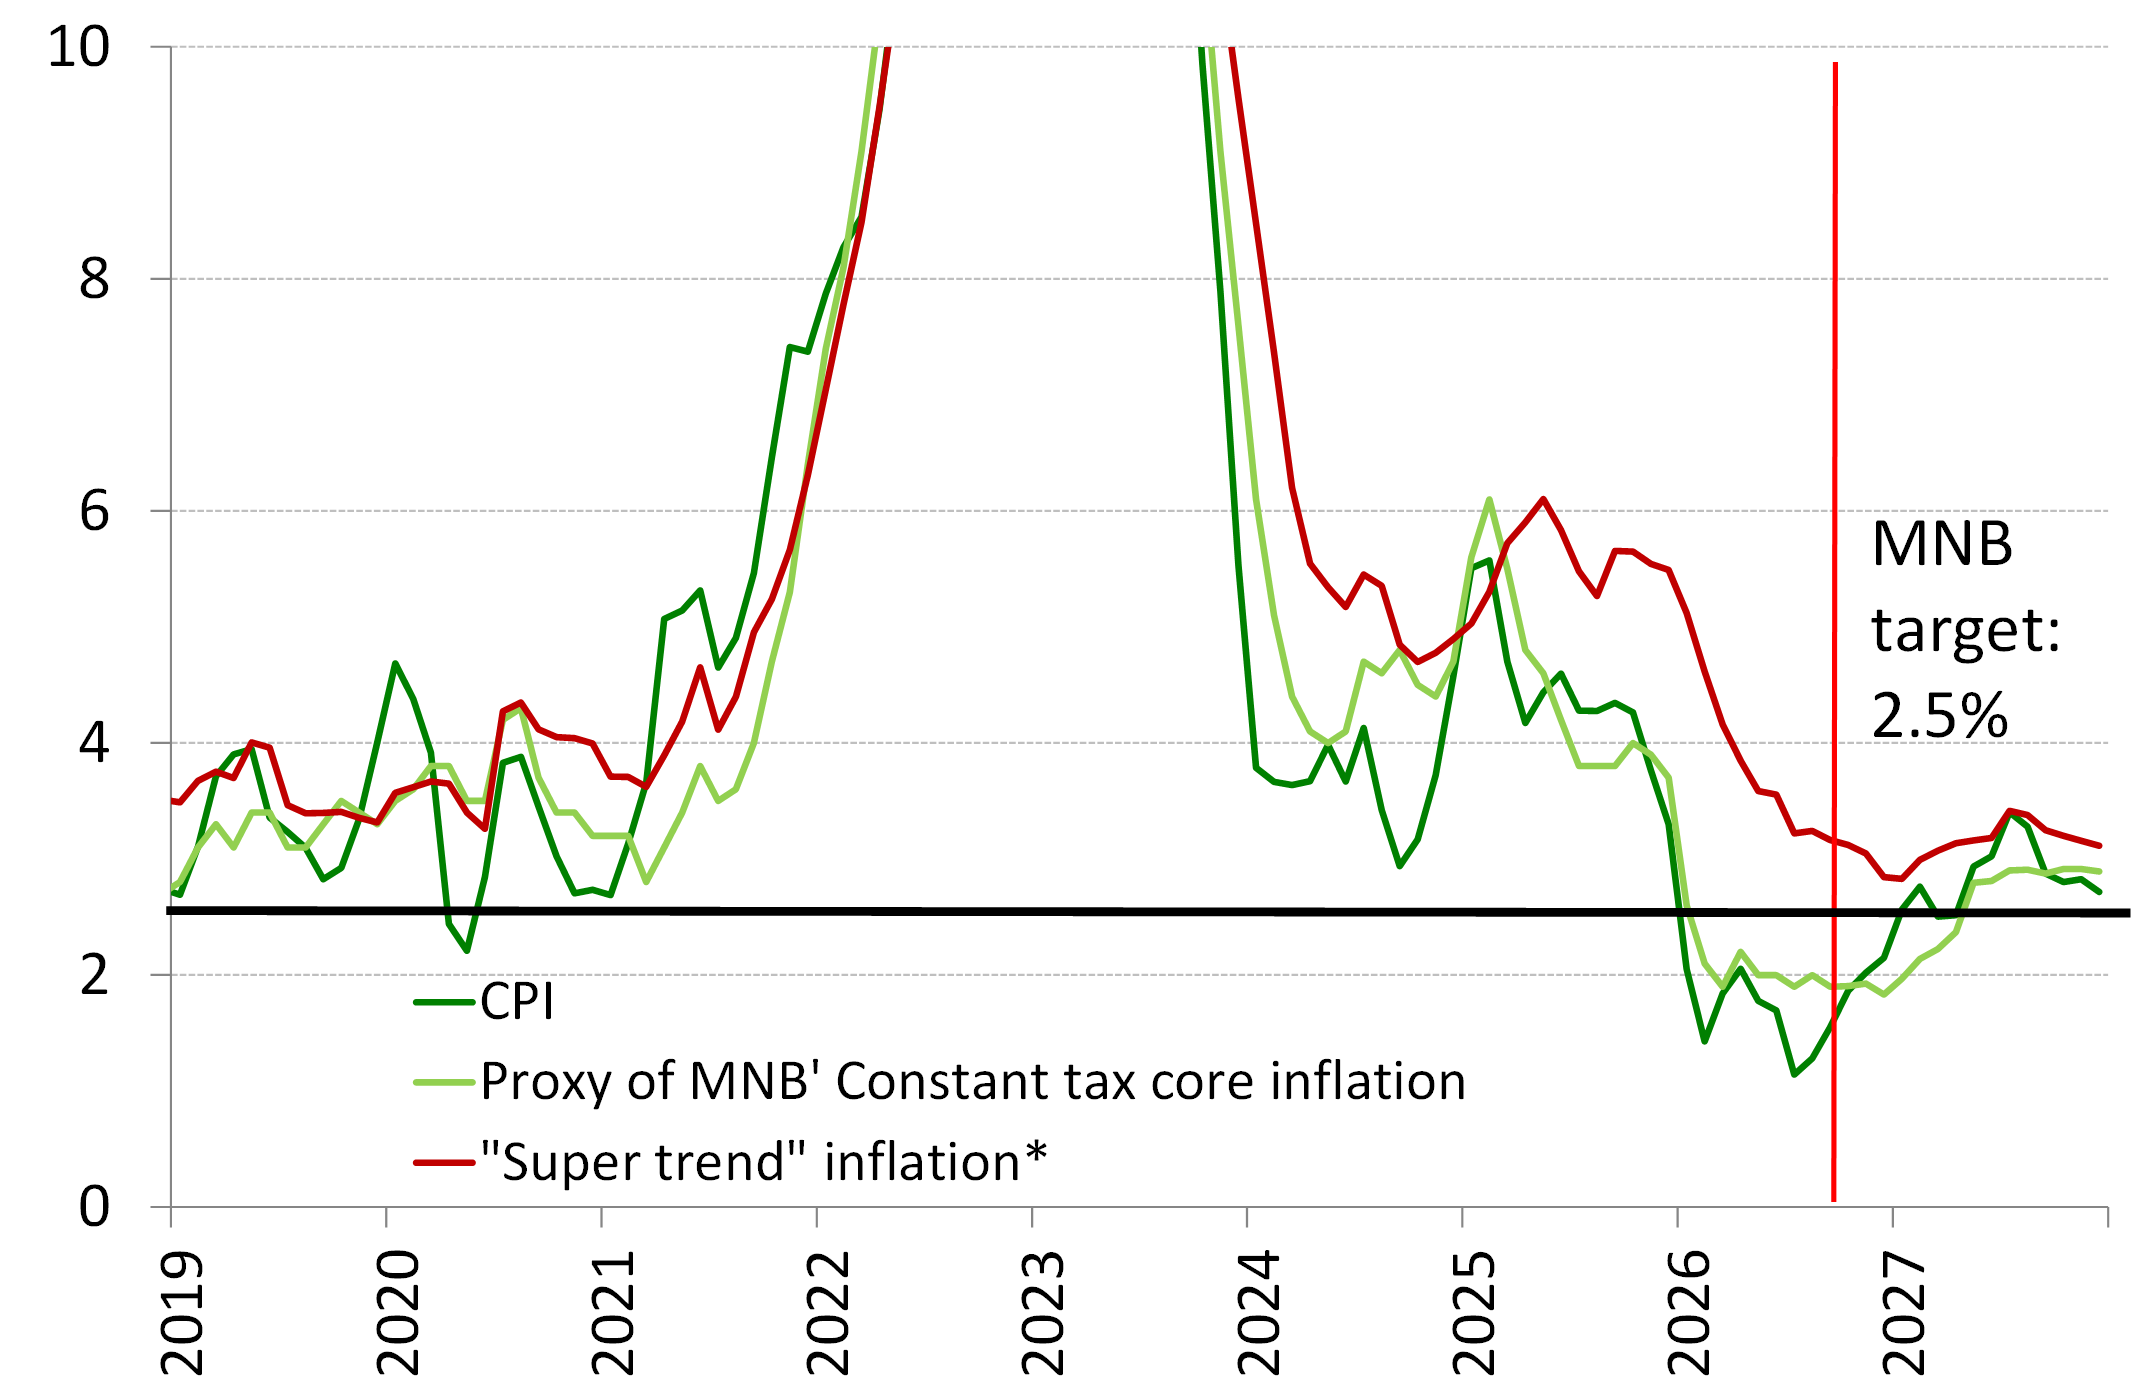
While the headline number increased less than expected, underlying indicators broadly stagnated on a YoY basis instead of the decline expected by us. The MNB’s constant-tax core inflation declined from 2.0% to 1.9% YoY, while sticky-price inflation increased from 3.8% to 3.9% YoY. The core inflation indicator excluding processed foods stagnated at 3.3% YoY. Our “supertrend” inflation indicator (Chart 9), which is similar to the aforementioned MNB indicators but does not contain the mainly backward-looking pricing of telecommunication and financial services and is filtered for the effects of the margin cap (therefore it is not affected by any administrative measures), increased from 3.6% to 4.6% on an annualized MoM basis, due to higher non-durable goods inflation compared to the previous month, while our filtered service inflation indicator stagnated. In the case of non-durable goods the upside surprise was relatively widespread among the sub-groups, as 4 out of 9 sub-groups’ inflation was higher than our forecast. The bigger picture, however, is that in Q3 the annualized QoQ growth increased to 2.9% from 2.7% in Q2 and 2.3% in Q1. It means the significant downside surprise in July – our “supertrend” indicator was only 0.5% - did not prove long-lasting and strengthens our view that an EUR/HUF exchange rate of around 360 (or below) is necessary to meet the new 2.5% inflation target. But the good news is that household and corporate inflation expectations have declined significantly in recent months. Latter increased during the spring and early summer months – most probably due to the situation in the Strait of Hormuz – but it seems those concerns were exaggerated.
The main reason for the lower-than-expected headline inflation was primarily driven by a decline in administered prices, while fuel inflation came in only marginally below our forecast. The downside surprise in administered prices mainly reflected a 2% MoM decline in pharmaceutical prices following the VAT reduction on certain subsidized pharmaceutical products introduced in September, as well as a 5% monthly fall in air fare prices. Latter is quite surprising due to the recent rise in the kerosine prices. Notably, gambling prices also declined in September. It is also quite surprising as in August lottery ticket prices and other products offered by Hungary’s state-owned gambling operator (Szerencsejáték Zrt.) were increased around 25%, and this price hike did not appear either in the August inflation data.
Food prices continued to decline roughly in line with expectations, and they still significantly contributed to the very low inflation in Hungary. However, prices of several agricultural commodities have started to rise in recent months, reinforcing our view that food prices will no longer contribute to disinflation in 2027.
We kept our 2026 inflation forecast unchanged at 1.7%, but we raised our 2027 inflation forecast from 2.6% to 2.9%. This is mainly because of the announced excise duty hike on tobacco products (~0.2ppts) and higher energy prices. Previously we mentioned, it may have room for only one further rate cut this year, if the medium-term fiscal and macroeconomic outlook that will be published in October will reinforce the euro adoption narrative and help decouple domestic monetary policy from international trends. But in the light of the less-favorable underlying inflation trends in September and persistently high energy prices we now believe that a December rate cut requires not only the previously mentioned condition to be met, but also a decline in international energy prices by then.
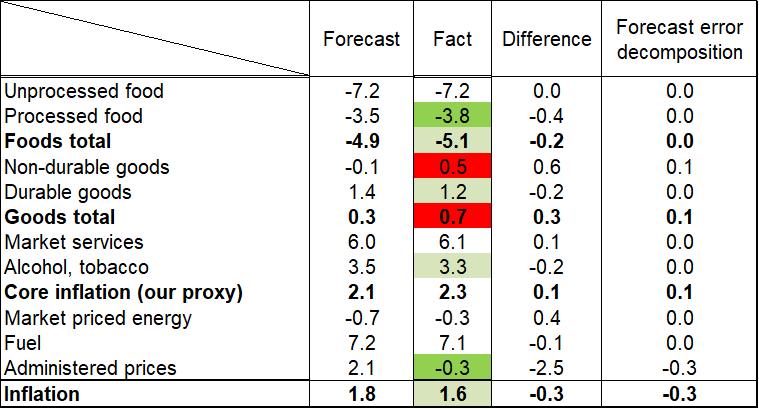
Inflation forecast (annual changes, %)
Get more out of your investments!
Global Markets Services
OTP Global Markets offers a broad range of services in the field of local and international money and capital markets.
Read morePrivate Banking Services
Personal care and expertise with OTP Private Banking, along with the knowledge, security, and innovations of a multinational banking group.
Read more