
Hungary: Inflation in July declined to 1.2% YoY much below the expectations; it seems the exchange rate has started to work
Related content
FX - Technical Analysis
The dollar has reached key support levels against both the euro and the pound, where some buying interest has already emerged. As a result, the charts are increasingly pointing to the possibility of a corrective rebound. On a broader timeframe, however, there are still no clear signs of a sustained weakening trend in the dollar. Following a period of weak performance, the forint has reached a resistance zone, where buying activity is once again evident against its major currency pairs; thus, a sideways, range-bound movement still appears likely. Although the USD/JPY exchange rate managed to rise, it continues to trade within a downtrend, so a trend reversal is still some time away. For this to happen, it is important that the exchange rate does not hit a new low. Following its rise, the EUR/CHF is undergoing a strong retest, so its long-term uptrend may now depend on key levels.
7.5% deficit is projected for 2026, and 5.2% for next year
7.5% deficit is projected for 2026, and 5.2% for next year, as the effect of previous tax cuts new spending measures build up, while one-off expenditures fall out in 2027.
Hungary's headline inflation decreased to 1.2% year-on-year in July from 1.7% in June. The published data was lower than the consensus (1.5%) and our forecast (1.6%). The lower-than-expected inflation was widespread among the main inflation categories.
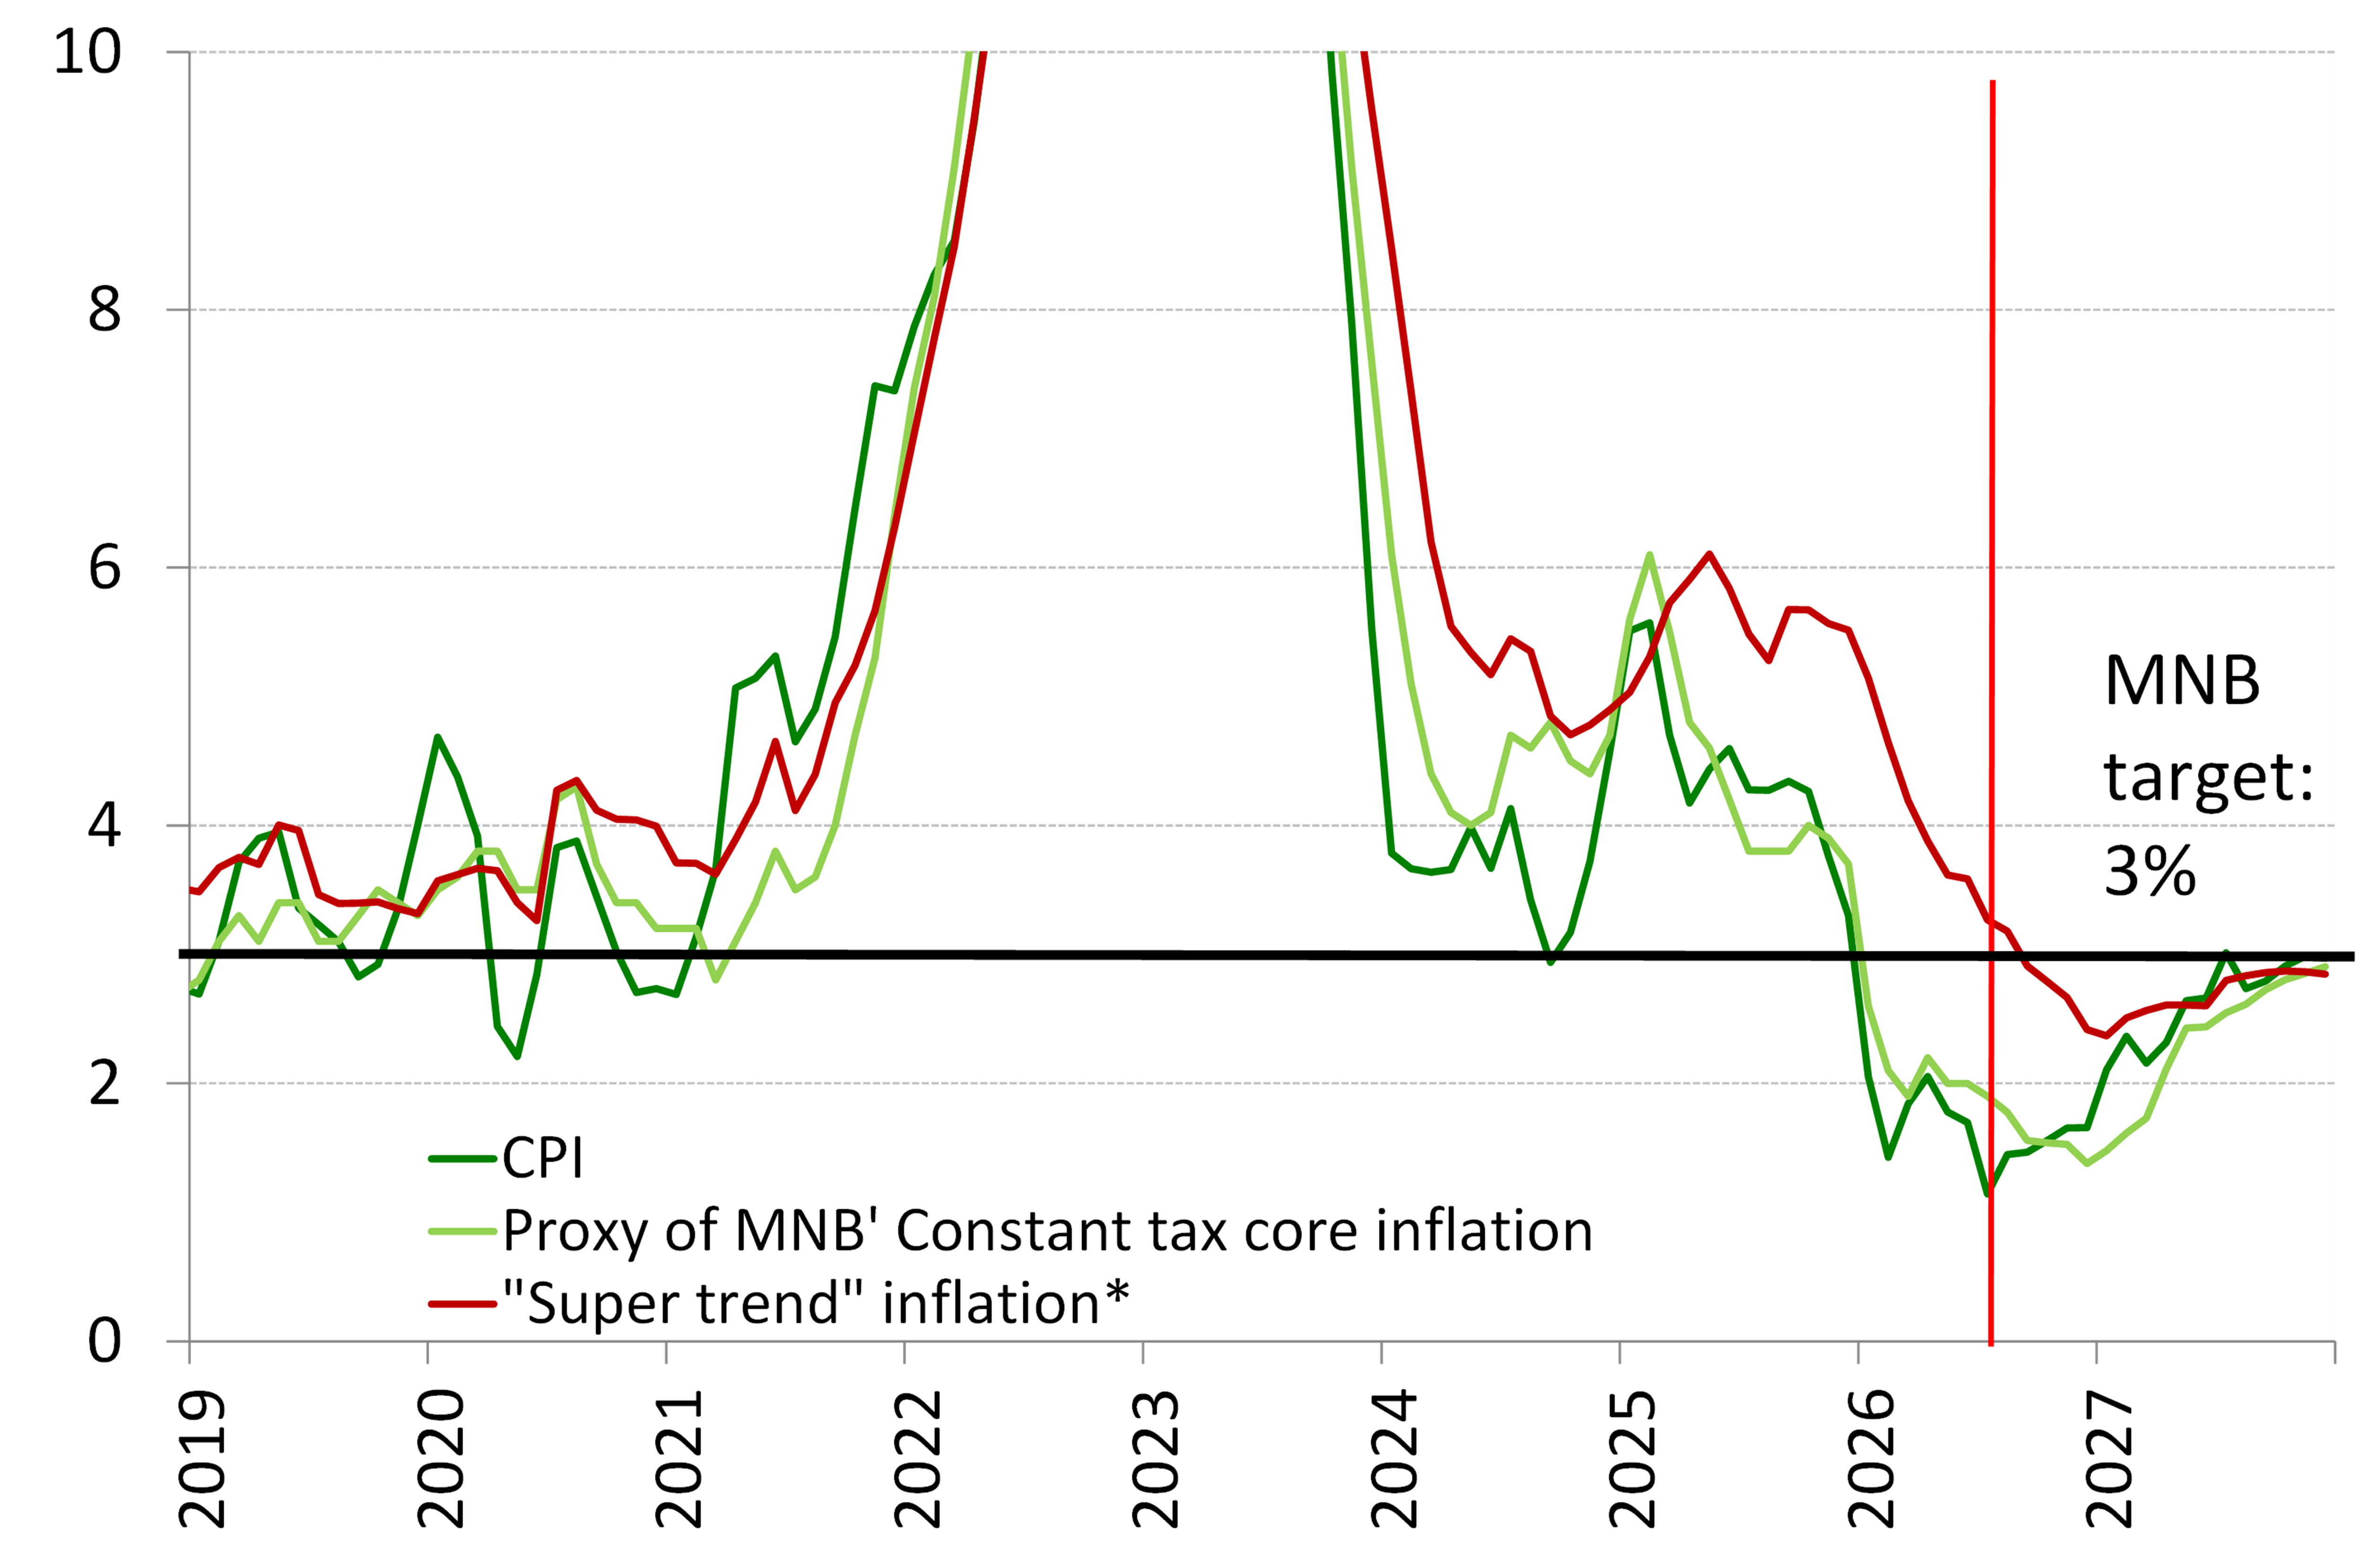
Underlying indicators showed a mixed picture, as they stagnated or slightly accelerated on a YoY basis, while there was a significant improvement on a MoM basis. The MNB’s constant-tax core inflation declined from 2.0% to 1.9% YoY, while sticky-price inflation increased from 3.6% to 3.8% YoY. The core inflation indicator excluding processed foods stagnated at 3.1% YoY. In contrast, our “supertrend” inflation indicator (Chart 9), which is similar to the aforementioned MNB indicator but does not contain the mainly backward-looking pricing of telecommunication and financial services and is filtered for the effects of the margin cap (therefore it is not affected by any administrative measures), declined significantly from 3% to 0.5% on an annualized MoM basis. As the voluntary price freezes in the telecommunication and financial services sectors ended at the end of June, many providers implemented inflation-indexed fee hikes. Our “supertrend” indicator does not contain these effects, but the MNB’s core inflation and sticky-price measures do. The only negative aspect of the July CPI data was market service inflation, which was higher than our forecast. There are two reasons for this: first, a larger-than-expected part of the inflation-indexed fee hikes appeared in the July CPI, but this is only a timing effect. Second, the annualized MoM rate of market service inflation excluding telecommunications and financial services accelerated to 6.9% in July from the 5.5% average of the previous four months.
The most significant and monetary policy-relevant surprise came from goods inflation, where both non-durable and durable goods inflation was significantly lower than we had expected. Furthermore, it is very unusual that even at the sub-item level (within non-durable and durable goods), there was no item that had higher-than-expected inflation. We assume it is a consequence of the stronger HUF because it seems corporates have now adjusted their prices to the stronger exchange rate.
Food inflation delivered a positive surprise again. But now, the entire surprise came from seasonal food inflation. It is very hard to assess how the exchange rate can affect this product group. Indeed, bananas, oranges, etc. are 100% imported, but the fruits that are in season at this time of the year and have a domestic origin (watermelon, peaches, etc.) also have a significant effect on fruit prices. This statement is even more true for vegetables and potatoes. So, we rather think that the good season can be the main reason for the favourable price development.
Due to the significant downside surprise, we lowered our CPI forecast for 2026 from 2.0% to 1.7%. We also lowered our CPI forecast for 2027 from 2.9% to 2.6%. The main question is how long the current very favourable food inflation will last. Damage from the severe drought and the shortage of fertilizers may take their toll on next year’s agrocommodity prices. The incoming data further strengthen not only the by-now almost certain rate cut in August, but also our expectation of a 5% key rate by year-end. We think that after August the easing cycle can continue after the government publishes the medium-term fiscal and macroeconomic outlook that has to reinforce the euro adoption story and can help decouple from international trends. Currently, market pricing also suggests a 5% key rate by the end of 2026, with rate cuts in August, September, and December.
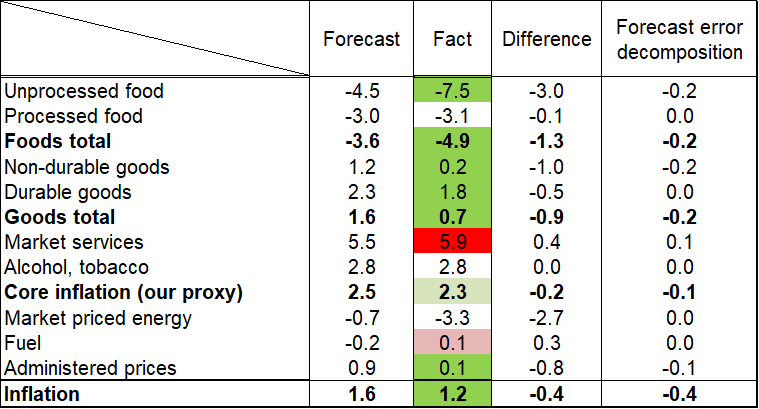
Inflation forecast (annual changes, %)
Get more out of your investments!
Global Markets Services
OTP Global Markets offers a broad range of services in the field of local and international money and capital markets.
Read morePrivate Banking Services
Personal care and expertise with OTP Private Banking, along with the knowledge, security, and innovations of a multinational banking group.
Read more