The Fertilizer Producer’s Chart May Be Showing Promise Again After a Long Time
Despite the sharp decline, a number of previously underperforming, lagging stocks are showing signs of life. At the same time, for these stocks, we have seen almost without exception only initial, concentrated buying reactions over the past few months. However, a sustained turnaround would require the formation of higher lows and the confirmation of clear reversal patterns. In light of this, it is worth monitoring the stocks listed in the first table on a daily basis, as additional positive trading days accompanied by rising volume could significantly increase the likelihood of an emerging uptrend. We’ve selected two companies from the long list. One is Take-Two Interactive Software, which, moreover, is set to release its quarterly earnings today after the market closes, while Grand Theft Auto VI—eagerly anticipated by investors and gamers alike—is scheduled for release in ten days. The other stock we’re highlighting is Mosaic Company, one of the world’s largest fertilizer manufacturers, which is also showing an increasing number of positive technical signals following a significant drop in its stock price.
The government crisis is over – what lies ahead for Romania?
Romania has experienced five turbulent months on the domestic political front. Nevertheless, after several prime ministerial candidates failed to secure parliamentary support, a new government was finally formed in late October. The Romanian equity market, which had performed strongly during the first half of the year, lost momentum towards the end of August and entered a downward correction in September. It then rebounded in October, partly reflecting the reduced risks of a snap election and a sovereign rating downgrade to below investment grade. While domestic political tensions have subsided, the BET index has yet to recover to the vicinity of its August peak. At the same time, Romanian equities no longer appear particularly inexpensive from a valuation perspective.
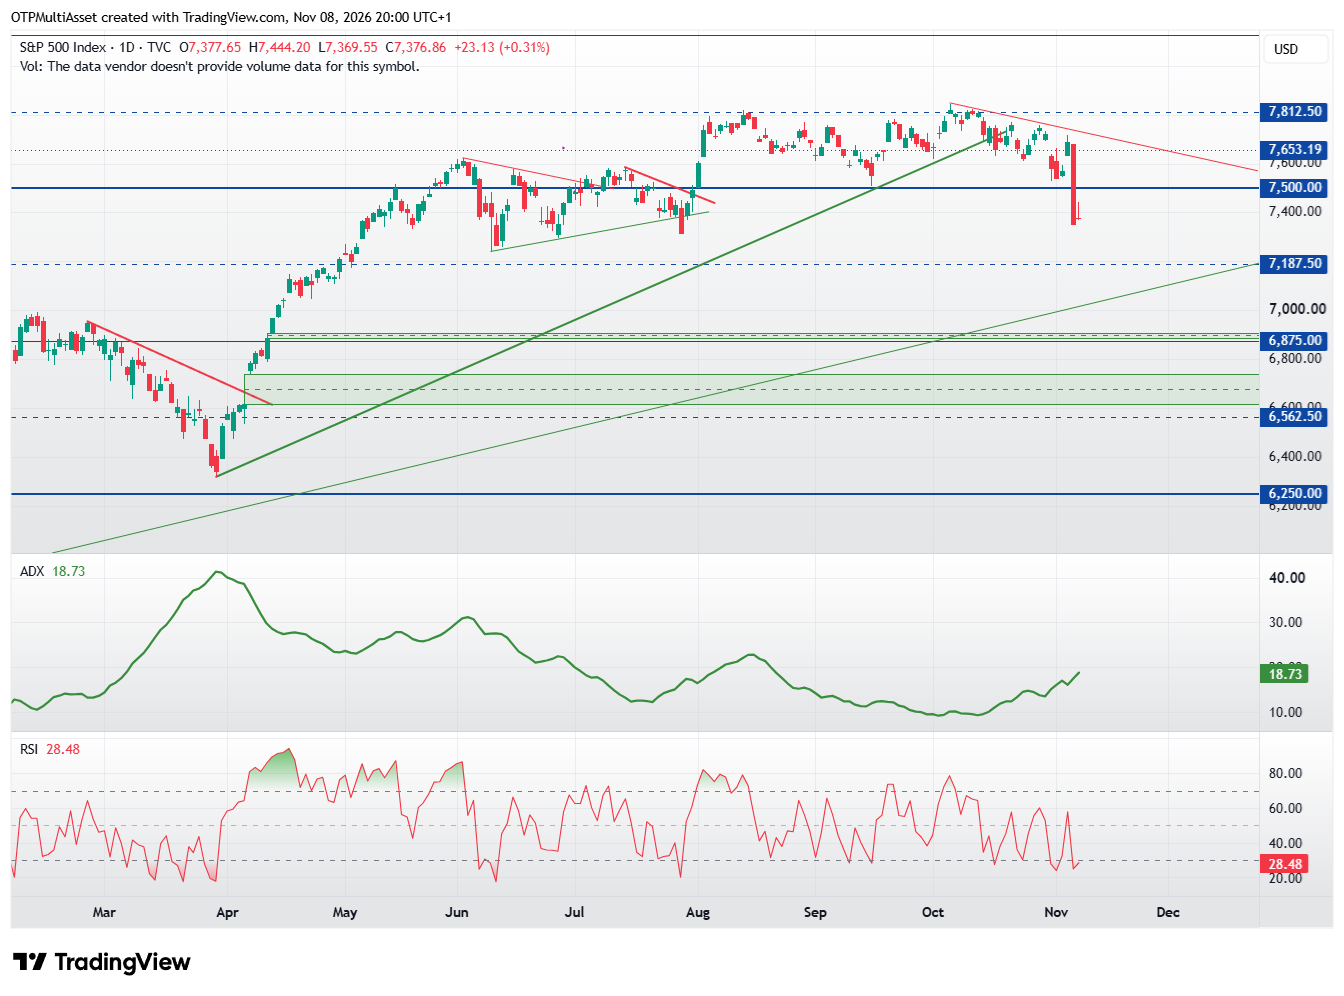
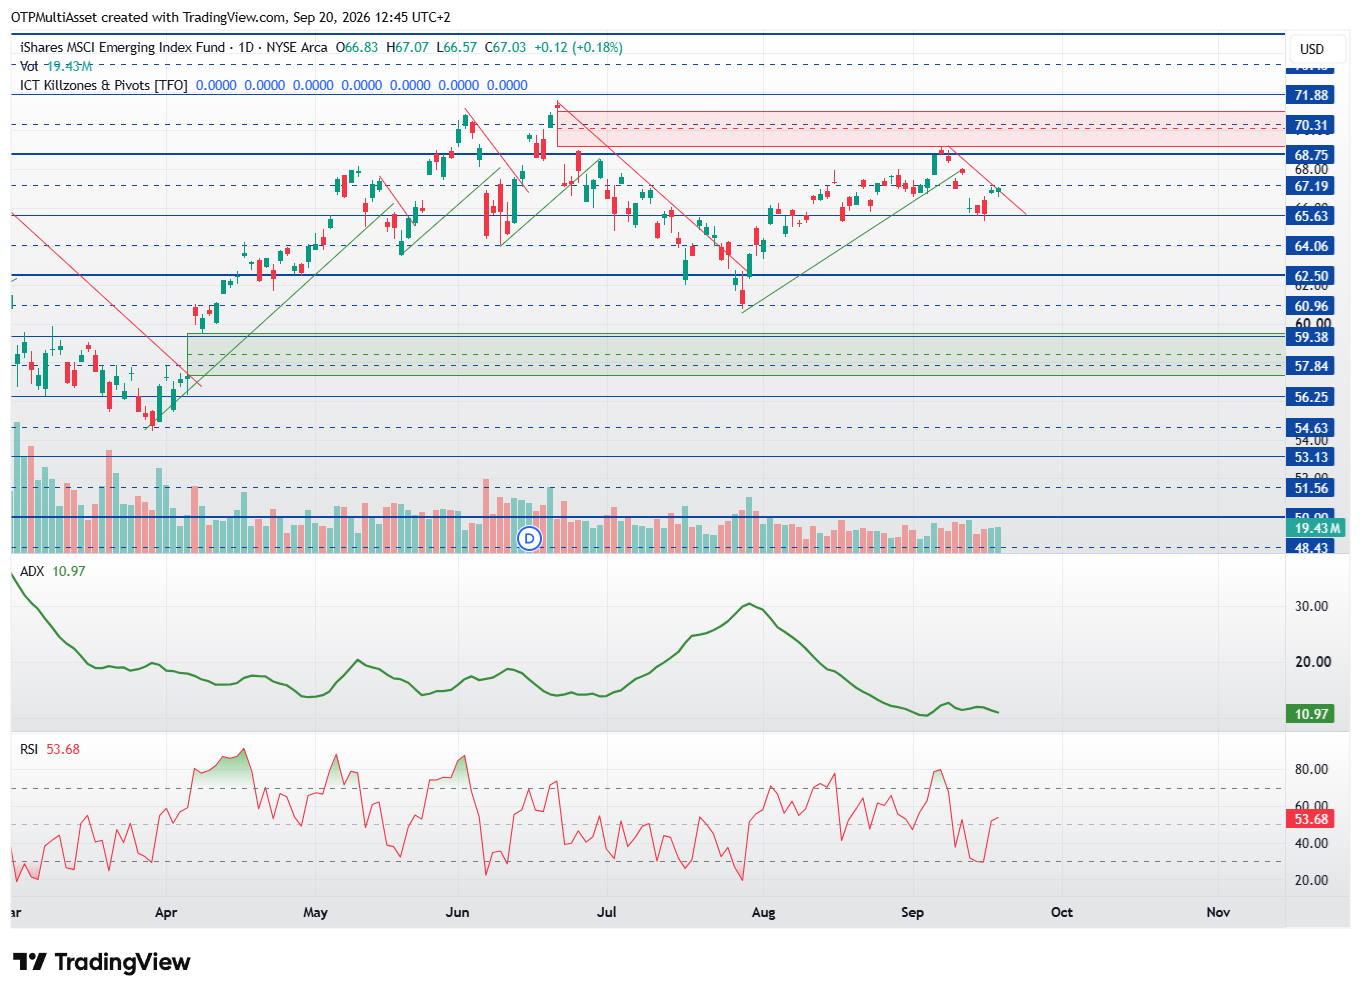
The correction phase, which has lasted two to three weeks, gained new momentum last Thursday when an extremely sharp sell-off swept through the markets. As for the major stock indices, no clear buying opportunities are yet visible, although some of them have already corrected back by about half of their previous upward moves. The DAX and Stoxx 600 indices attempted to retest their previous highs but encountered strong resistance at those levels. Furthermore, gaps have formed on the charts; if these gaps remain open, it could signal the start of a new, more sustained downtrend. The index tracking emerging markets continues to move within a downtrend, though it is gradually approaching an important support zone. If it reaches this level, there is a greater likelihood of a significant rebound or a corrective phase.
S&P500
S&P500
The downward trend continued, and we saw a very heavy sell-off last Thursday. Breaking below 7,500 paved the way for further correction. Support levels at 6,875 and 6,562 are worth noting as potential levels to test. It’s worth keeping an eye on the red downward trend line; as long as it remains intact, it’s unlikely that another bullish wave will form.
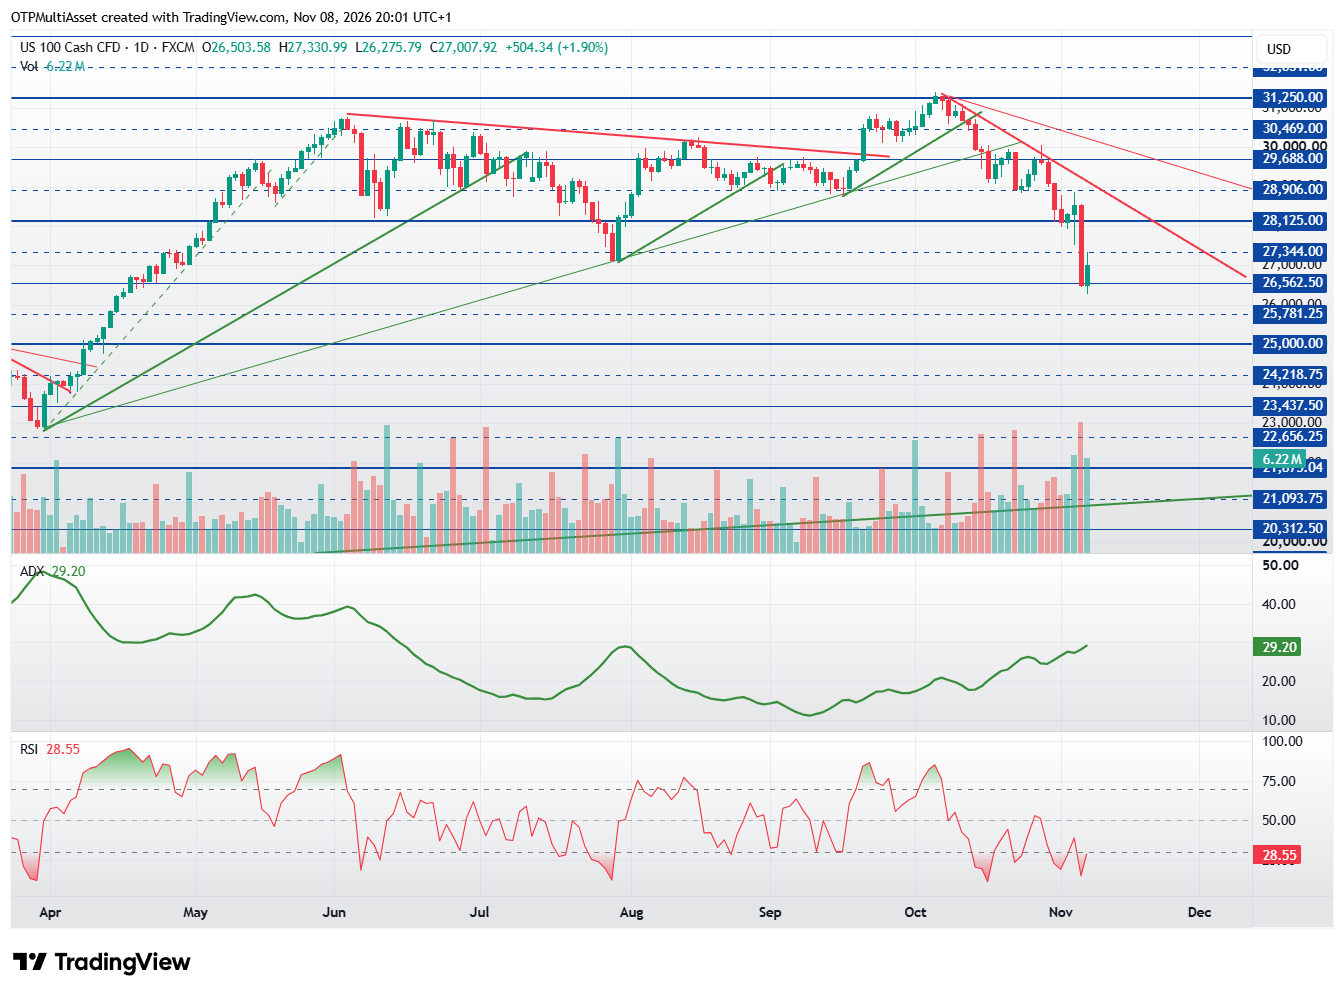
The upward trend broke down in mid-October, after which the downward trend continued, becoming even steeper in recent days. Reaching the range below 27,000 points in the last few days marked the target price, resulting in a retest of nearly half of the previous upward move. For now, it is not yet possible to definitively state that a buying opportunity has emerged, as the index may still be in a “falling knife” pattern, which could potentially lead to an even deeper correction. The technically significant natural support level at 26,562 points has halted the decline so far, but a break below this level could easily trigger another wave of selling. The thick red trendline may serve as a more reliable reference point: as long as the price cannot break through it, it will be difficult to open up meaningful room for further gains. The previous upward wave began with a close above the 24,218-point level, so the possibility cannot be ruled out that the index may retest this zone later on.
Resistance levels: 31,250; 31,640. Support levels: 28,125; 27,344; 26,562.
Russell 2000
Russell 2000
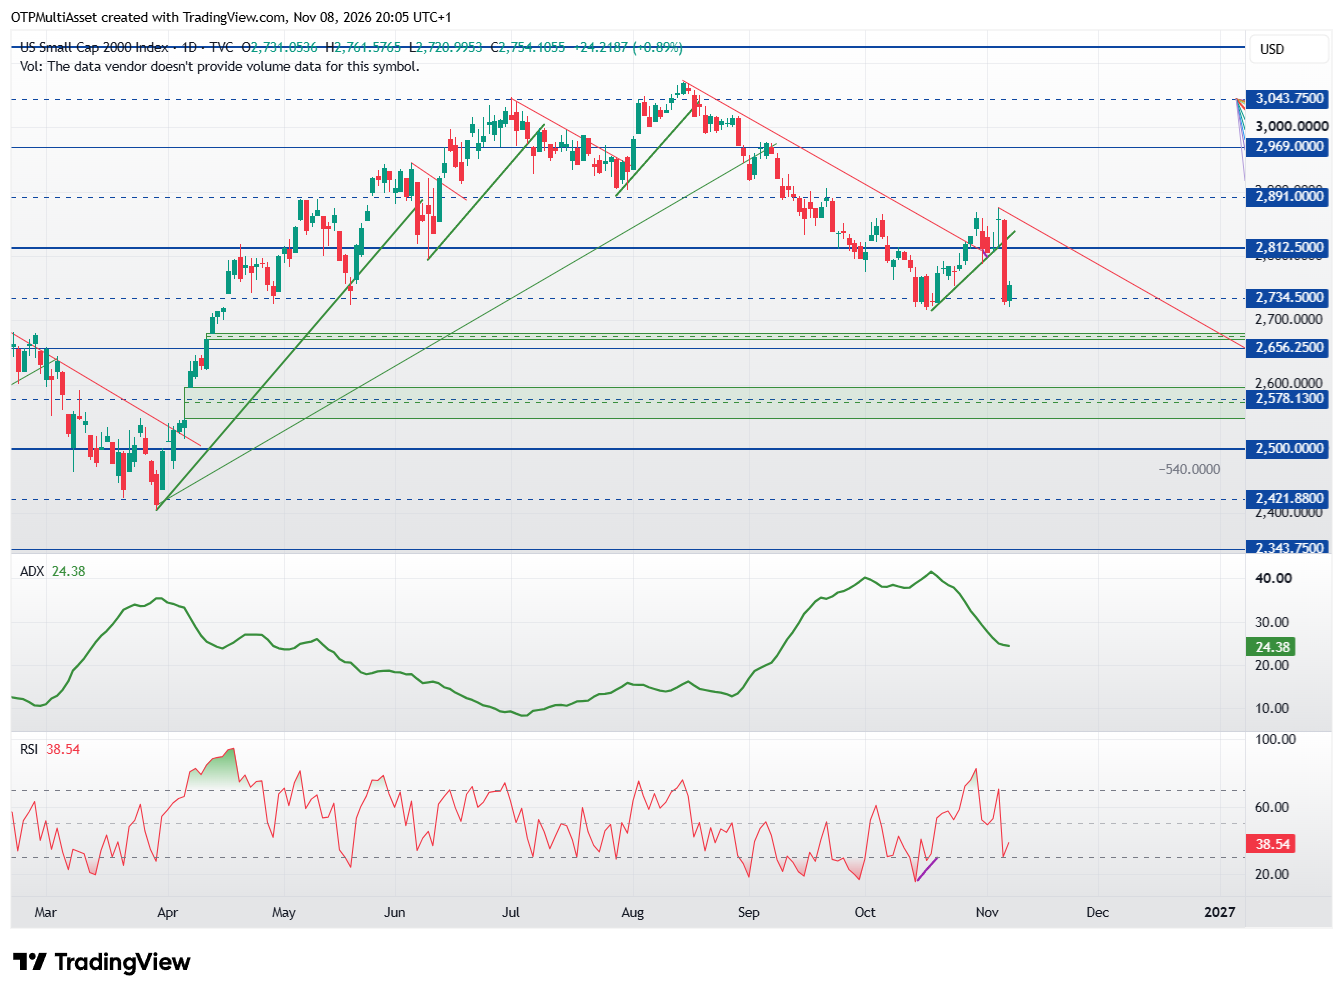
A sharp decline followed a minor correction. It broke well below the thick green trend line. This index had already been underperforming for quite some time, so it may continue its decline after a weak correction. There is an important level at 2,734, which was the previous ideal correction level. A break below the thick green trend line could lead to a new swing low. Strong support is expected around 2,578, and a test of that level could still be on the cards.
Resistance levels: 2,969; 3,043; 3,125. Support levels: 2,656; 2,578; 2,500.
DAX
DAX
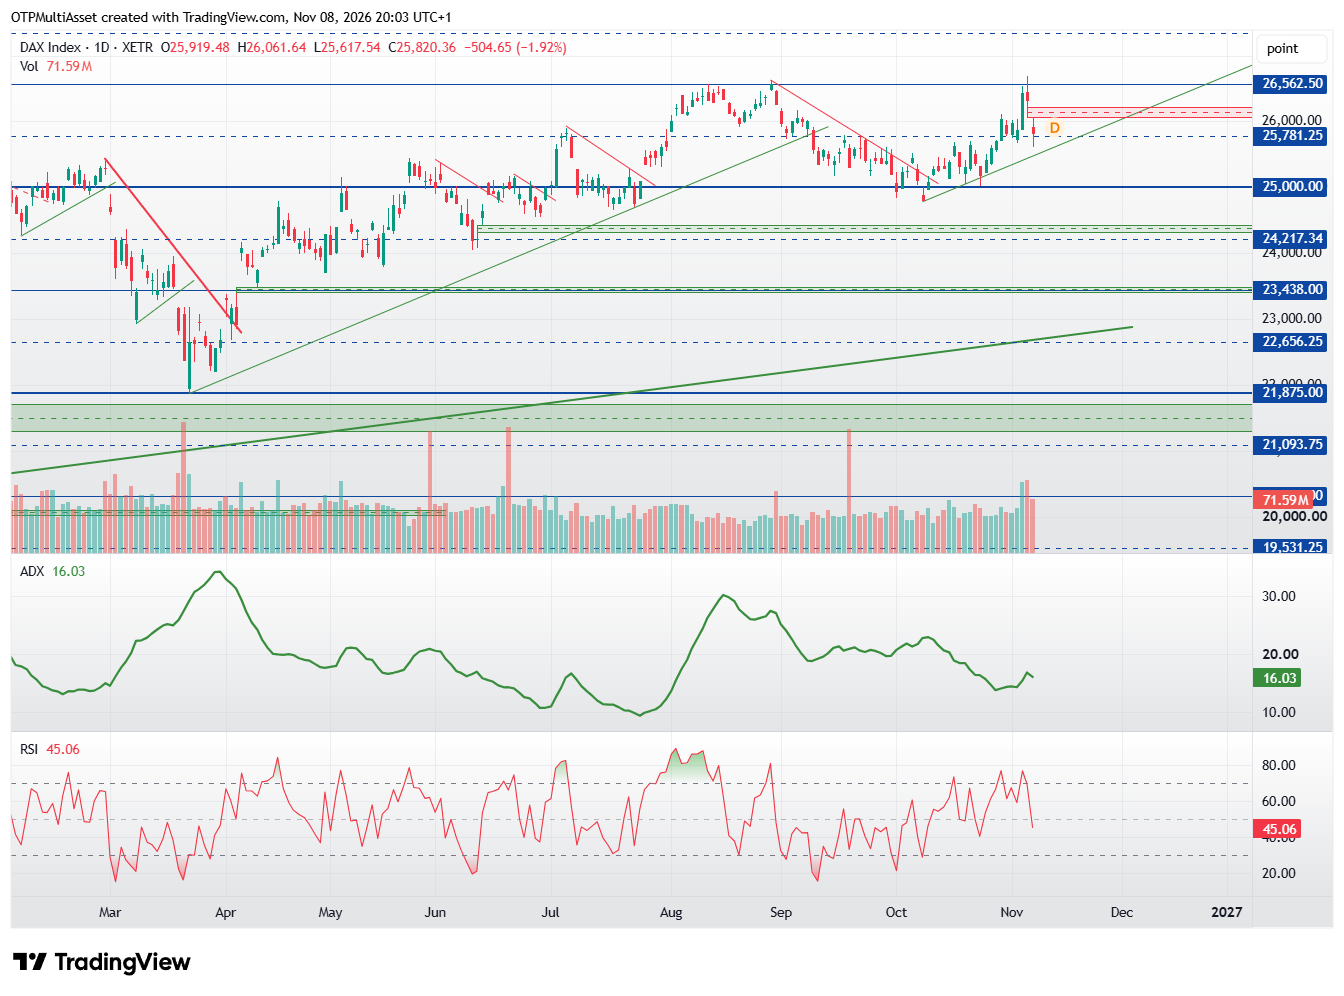
It hit a new high intraday, but the market firmly rejected any attempt to hold that level. A sharp decline followed, accompanied by a gap. If this gap isn’t filled within two days, it could be a strong bearish signal. Below the thin green trendline, there would be room for the decline to continue; in this case, it could even reach a new swing low below 25,000. The index could even fall to the midpoint of the previous major uptrend, which is around 24,218. A retest of the previous breakout point at 23,438 is also a possibility.
Resistance levels: 25,781; 26,562. Support levels: 24,218; 23,438; 22,656.
Stoxx 600
Stoxx 600
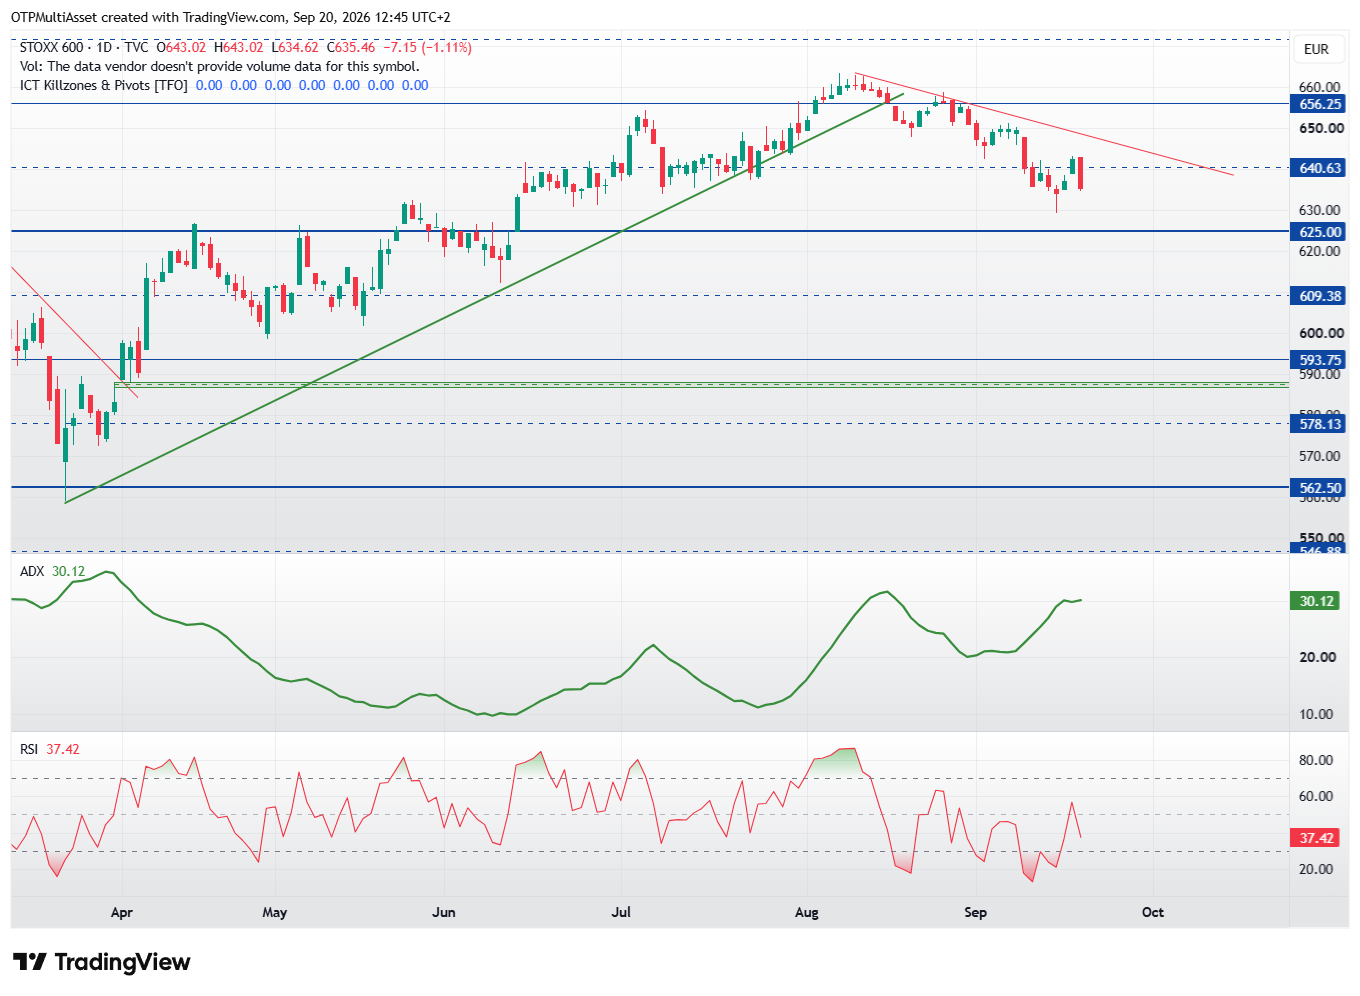
The index also rejected the retest of the August high with a very strong reaction. It even left a gap down; if this gap is not filled within two days, it will be a strong bearish signal. If it breaks through the thick green uptrend line—which would mean closing below 640.6—a trend-like decline could begin. In that case, a new swing low could also appear. This means the index could fall below the 625 level. Very strong support is expected around 594.
The decline has effectively reached the anticipated zone below 59.38, which previously served as the starting point of the uptrend. This area could offer an attractive setup for long positions, but given the current market environment, it would be prudent to wait for confirmation and a trend reversal before entering. Otherwise, there is a risk of entering too early against the prevailing downtrend. A break above the thin red trendline could provide such a bullish signal. The stock is currently heavily oversold, leaving room for a corrective rebound both in terms of price and time. However, buyers first need to demonstrate strength by producing at least one convincing bullish session.
Resistance levels: 68.75; 71.88. Support levels: 57.84; 56.25; 53.13; 50.
Get more out of your investments!
Global Markets Services
OTP Global Markets offers a broad range of services in the field of local and international money and capital markets.