7.5% deficit is projected for 2026, and 5.2% for next year
7.5% deficit is projected for 2026, and 5.2% for next year, as the effect of previous tax cuts new spending measures build up, while one-off expenditures fall out in 2027.
Hungarian Equities - Technical Analysis
The BUX index broke its rising market structure last week, suggesting that the prolonged upward wave may have come to an end. MOL has also remained in correction phase since the dividend payment and has now fallen below the 5,000 level, leaving the next significant support considerably lower. Richter found support around 12,180, but no convincing reversal signal has been confirmed yet. Magyar Telekom continues to trade within an increasingly narrow range, with a high-momentum session likely needed to provide short-term direction. Opus remains in a downtrend. Rába is also moving within a broad trading range, although another upward wave could develop later if the necessary technical conditions are met.
The dollar has reached key support levels against both the euro and the pound, where some buying interest has already emerged. As a result, the charts are increasingly pointing to the possibility of a corrective rebound. On a broader timeframe, however, there are still no clear signs of a sustained weakening trend in the dollar. Following a period of weak performance, the forint has reached a resistance zone, where buying activity is once again evident against its major currency pairs; thus, a sideways, range-bound movement still appears likely. Although the USD/JPY exchange rate managed to rise, it continues to trade within a downtrend, so a trend reversal is still some time away. For this to happen, it is important that the exchange rate does not hit a new low. Following its rise, the EUR/CHF is undergoing a strong retest, so its long-term uptrend may now depend on key levels.
EURUSD
EURUSD
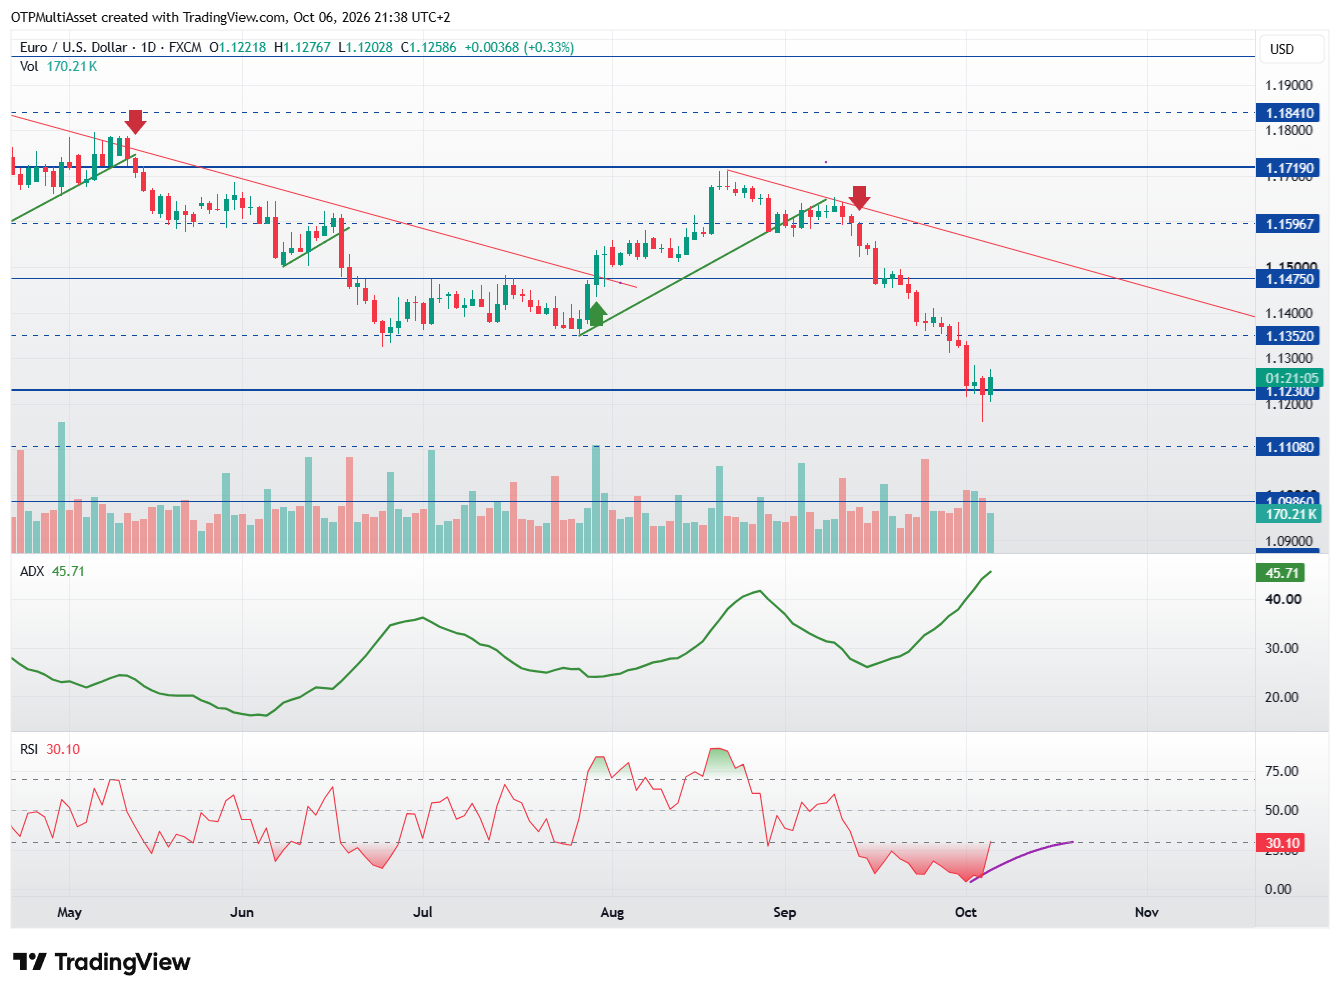
The exchange rate, in a trend-like decline, has reached a zone that could trigger a correction. Stronger buying interest has emerged around the 1.1230 support level, suggesting that the decline may soon give way to a corrective upswing. The broader technical picture remains negative, suggesting that only a smaller corrective rebound may develop in the near term. The 1.1475 area represents strong resistance; based on the current pattern, a move beyond this level cannot be anticipated. A structural shift is still a long way off; this would require a higher swing low as well as a return to the key milestone level of 1.1719.
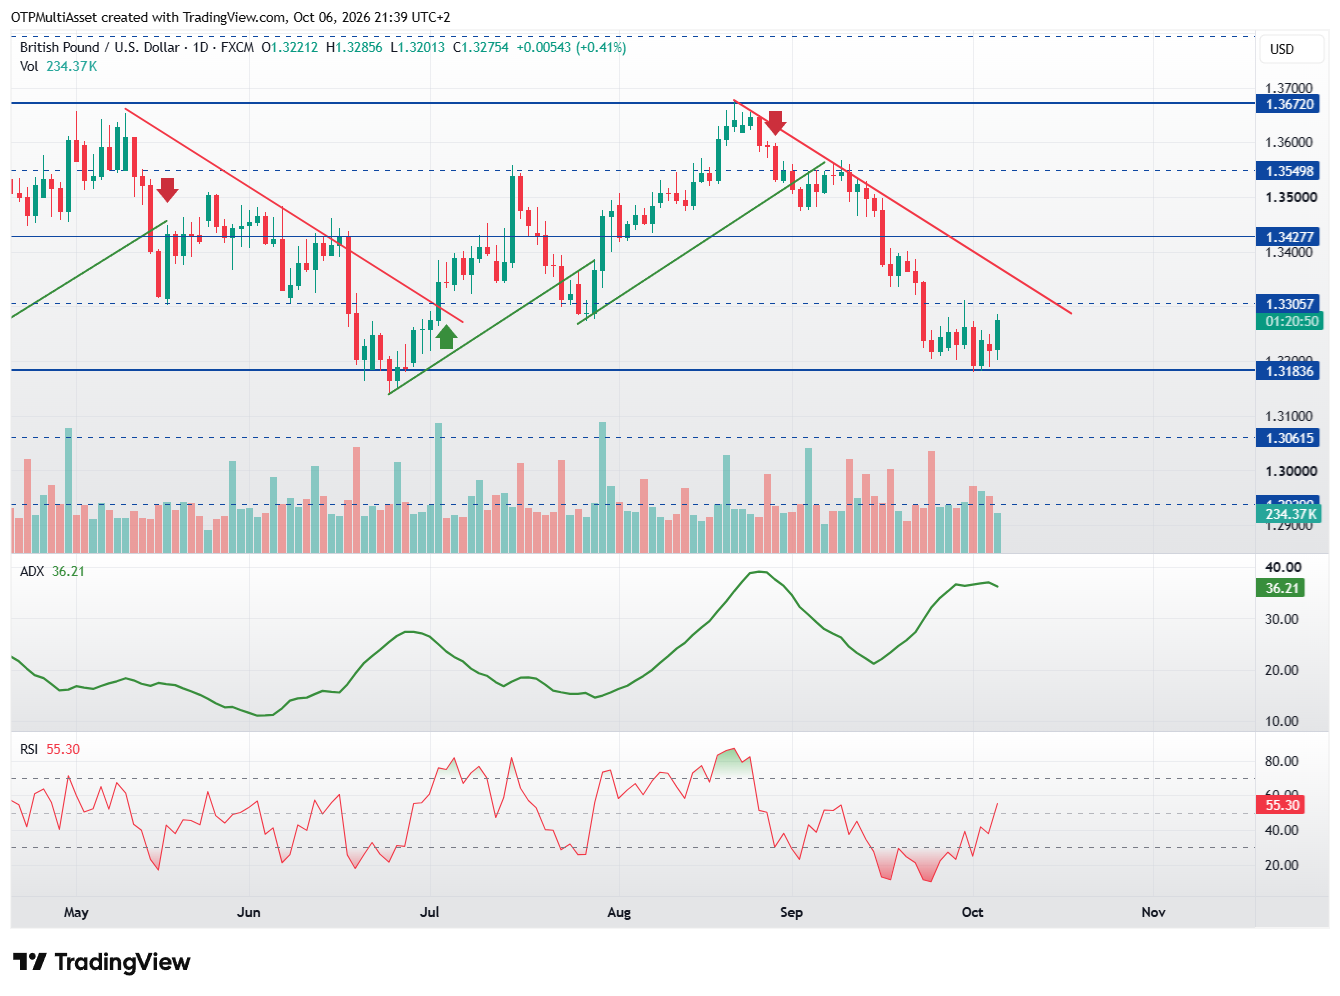
The graph did not hit a new low, even as the dollar strengthened, which could be a good sign for opening a long position. The downtrend and the structure would break at the 1.3306 level.
Resistance levels: 1.3672; 1.3916; 1.4160. Support levels: 1.3184; 1.2939; 1.2812.
EURHUF
EURHUF
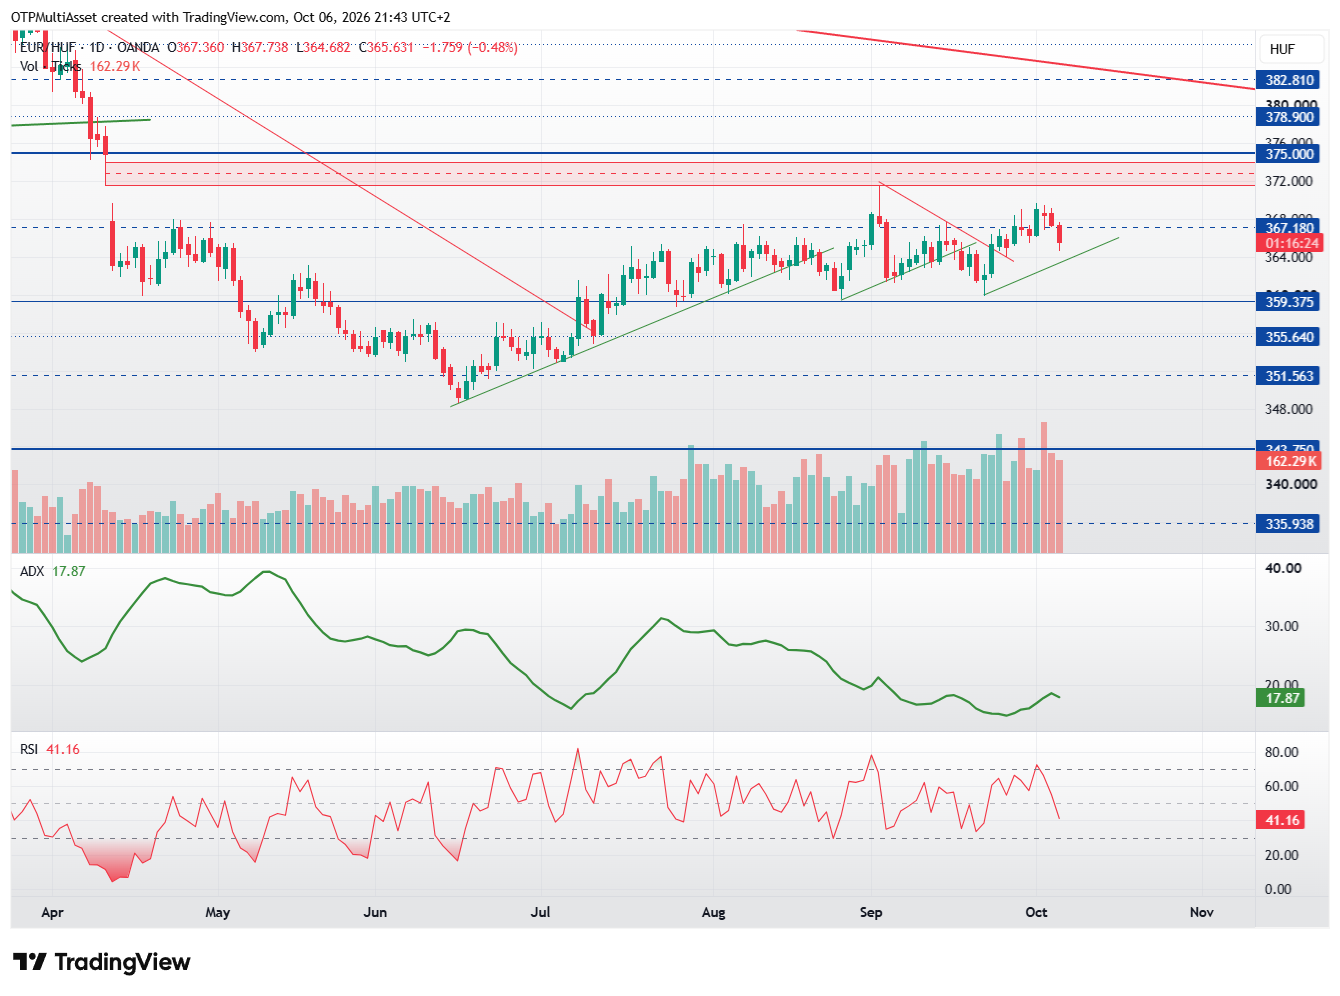
It may encounter resistance above 367, while it could find support below 359 in the short term. The downtrend is still far away, and the price could remain within this range for quite some time. The zone between 351 and 355 would serve as very strong support, while the 375 level represents strong resistance. The price is likely to move within this range in the coming weeks.
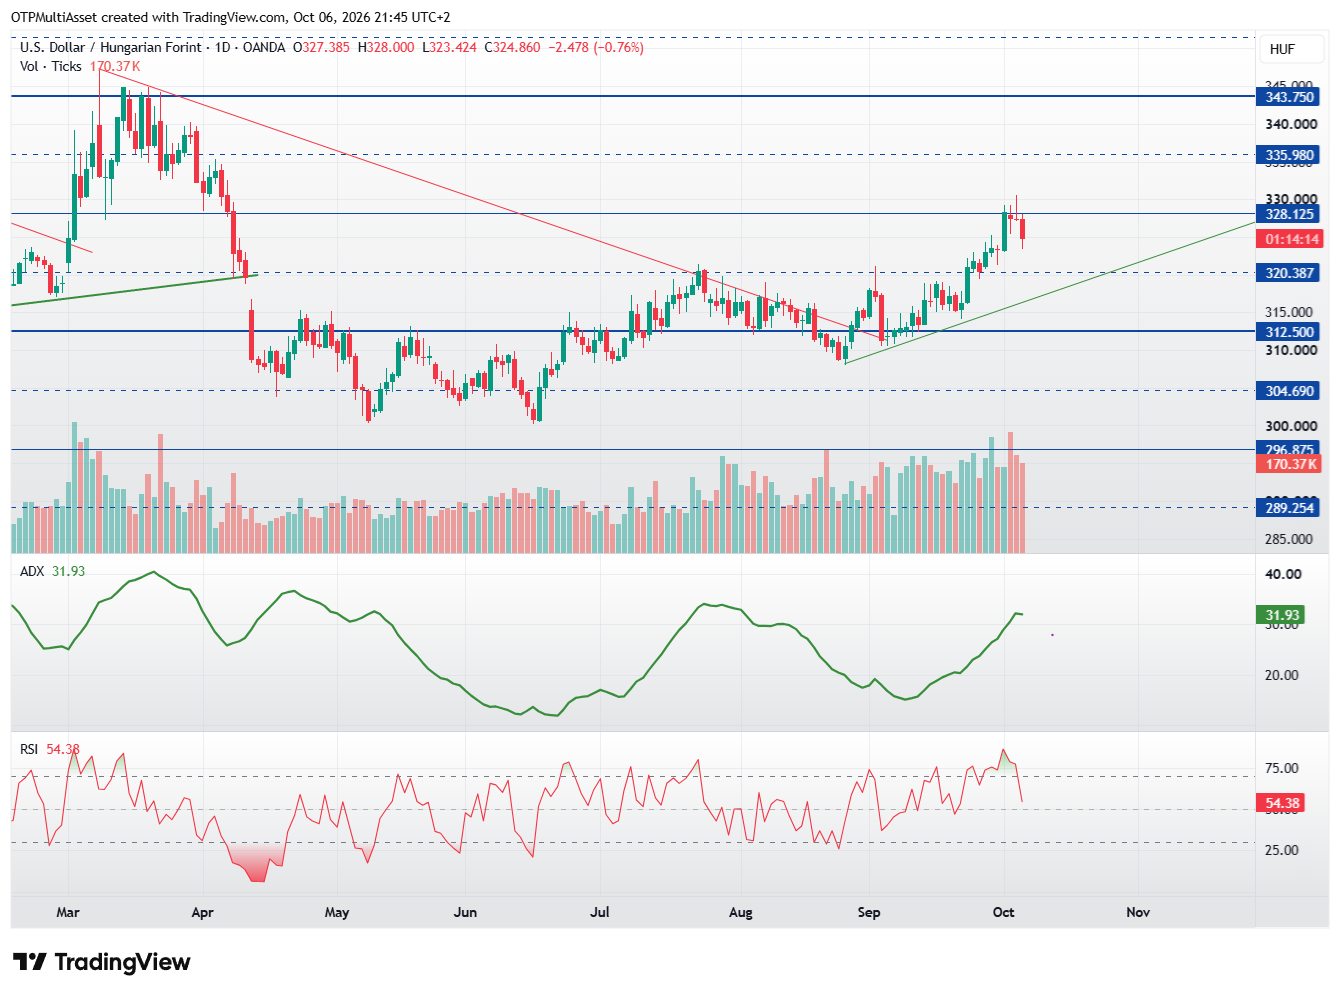
The uptrend reached resistance at 328.1, which stalled it and caused the price to reverse slightly. It could correct above the uptrend line for as long as one or two weeks without breaking the trend. A close below 320.4 could be a bad sign.
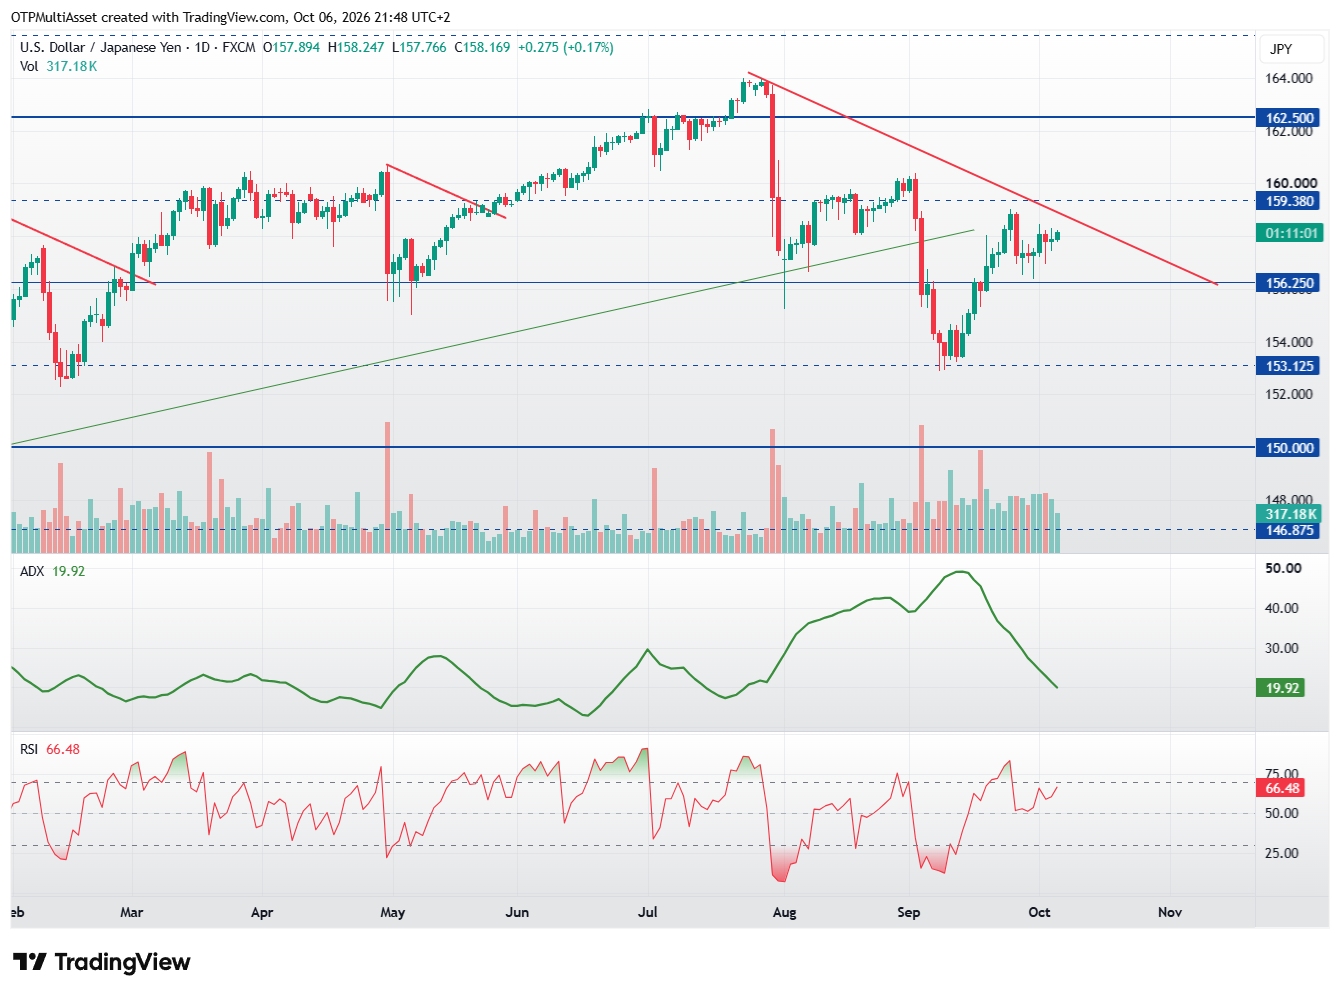
Following the strong retest, the descending trendline remains intact, and the broader trend continues to point lower. If a new downward wave fails to establish a fresh swing low, the chances of a reversal could improve over time. The downtrend is currently aligned with the 159.38 level.
Resistance levels: 162.5; 165.63; 168.75. Support levels: 153.13; 151.56; 150.
EURCHF
EURCHF
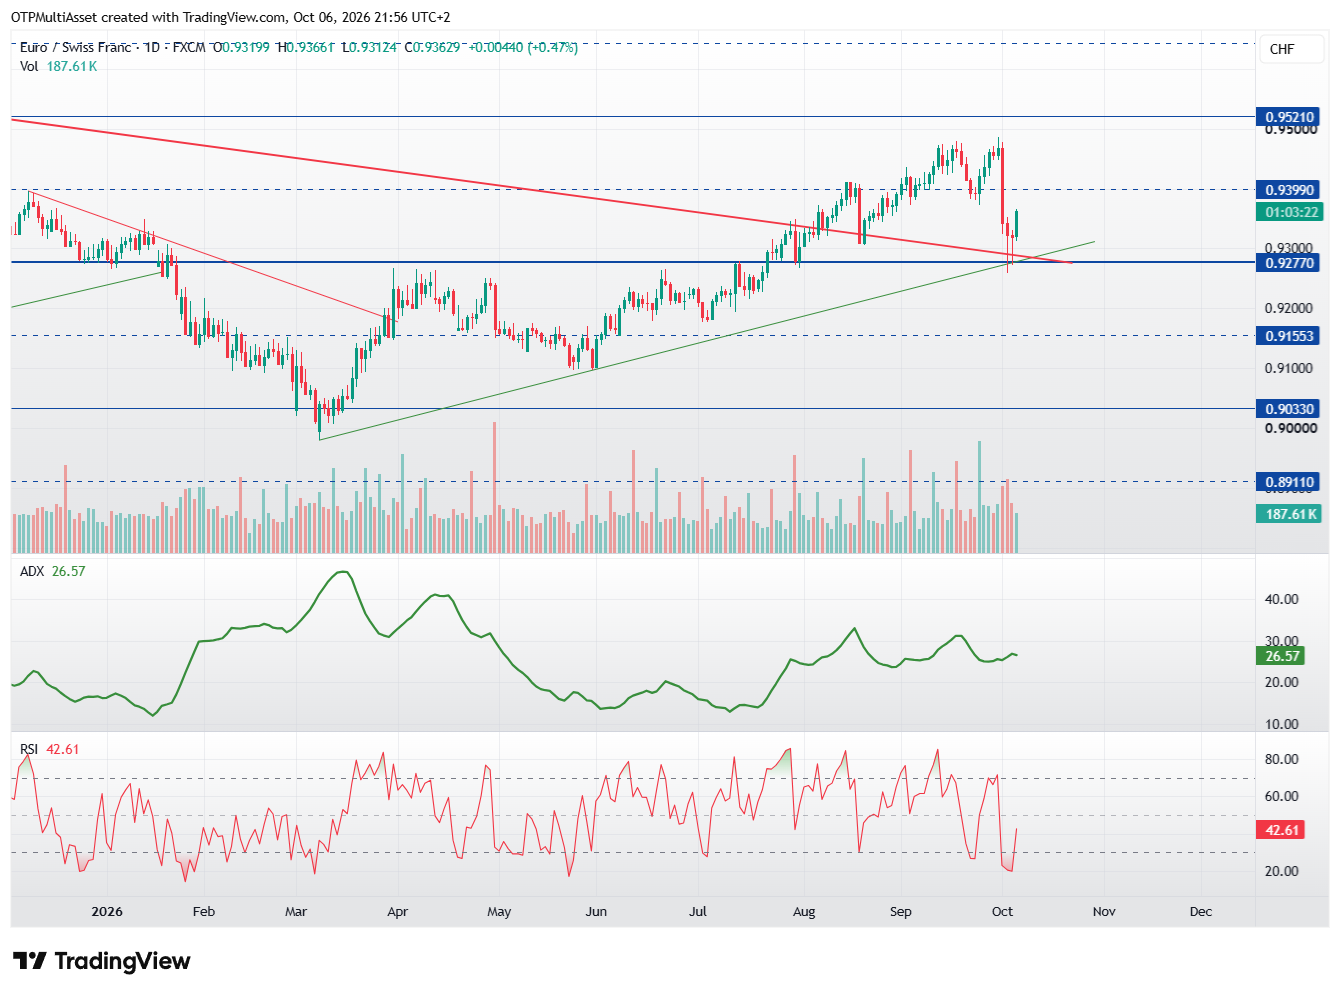
A structural shift occurred a few weeks ago, but we still saw a strong retest last week. This has not yet broken the last support level at 0.9277. As long as it stays above the thin green trendline, the uptrend may continue.