The third-quarter earnings season in the US has picked up pace following the release of the latest figures from US banks. Based on preliminary expectations, the third quarter is likely to have closed with strong earnings growth for S&P 500 companies, led by the energy and technology sectors. The major US banks have still achieved solid growth on an annual basis, indicating that their operations remain strong, but the pace has clearly slowed in many cases, which has tended to result in negative share price reactions.
Commodities - Technical Analysis
Gold and silver continued their downward trend, bouncing off key levels. Until their downward trends are broken, they will not be able to produce a significant rise. The fall in oil prices reversed from the $87.5 level and began a slight upward movement. Natural gas remained in an uptrend; a significant rise could even occur if it breaks out upwards. The price of copper has become stuck in a wider range, so the oversold and overbought zones may offer more favourable trading opportunities. The falling prices of wheat and corn have reached key support levels; a buying reaction from these levels could present favourable long opportunities with limited risk.
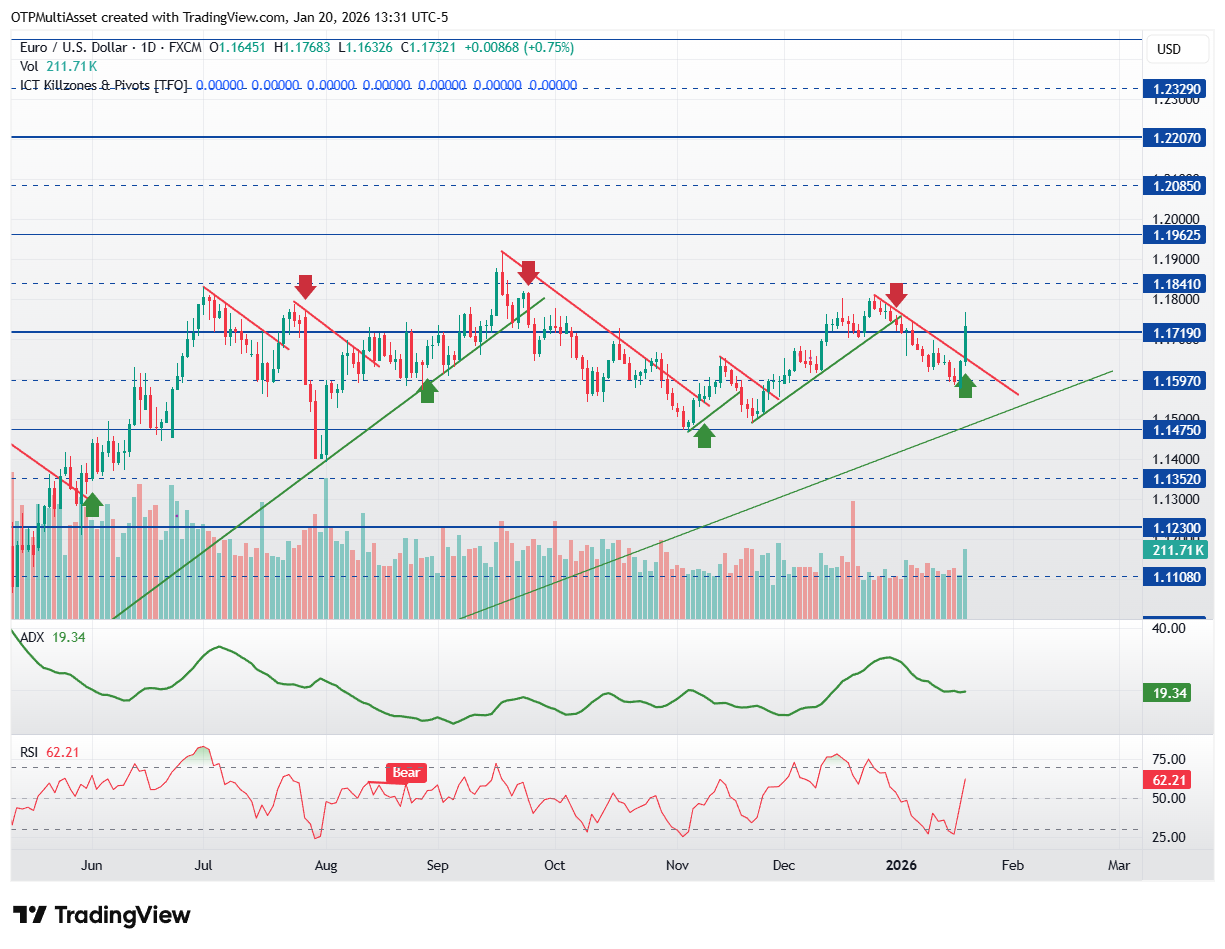
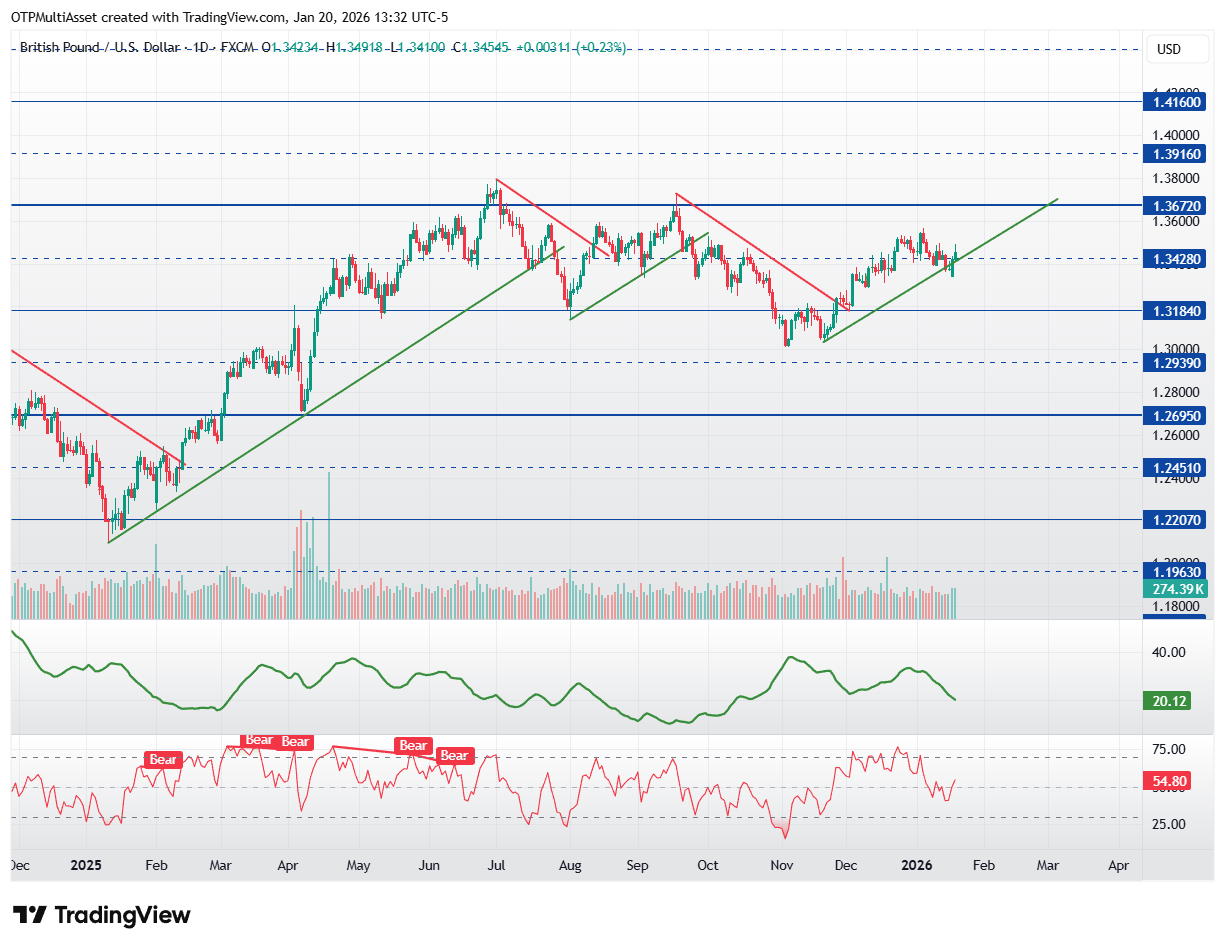
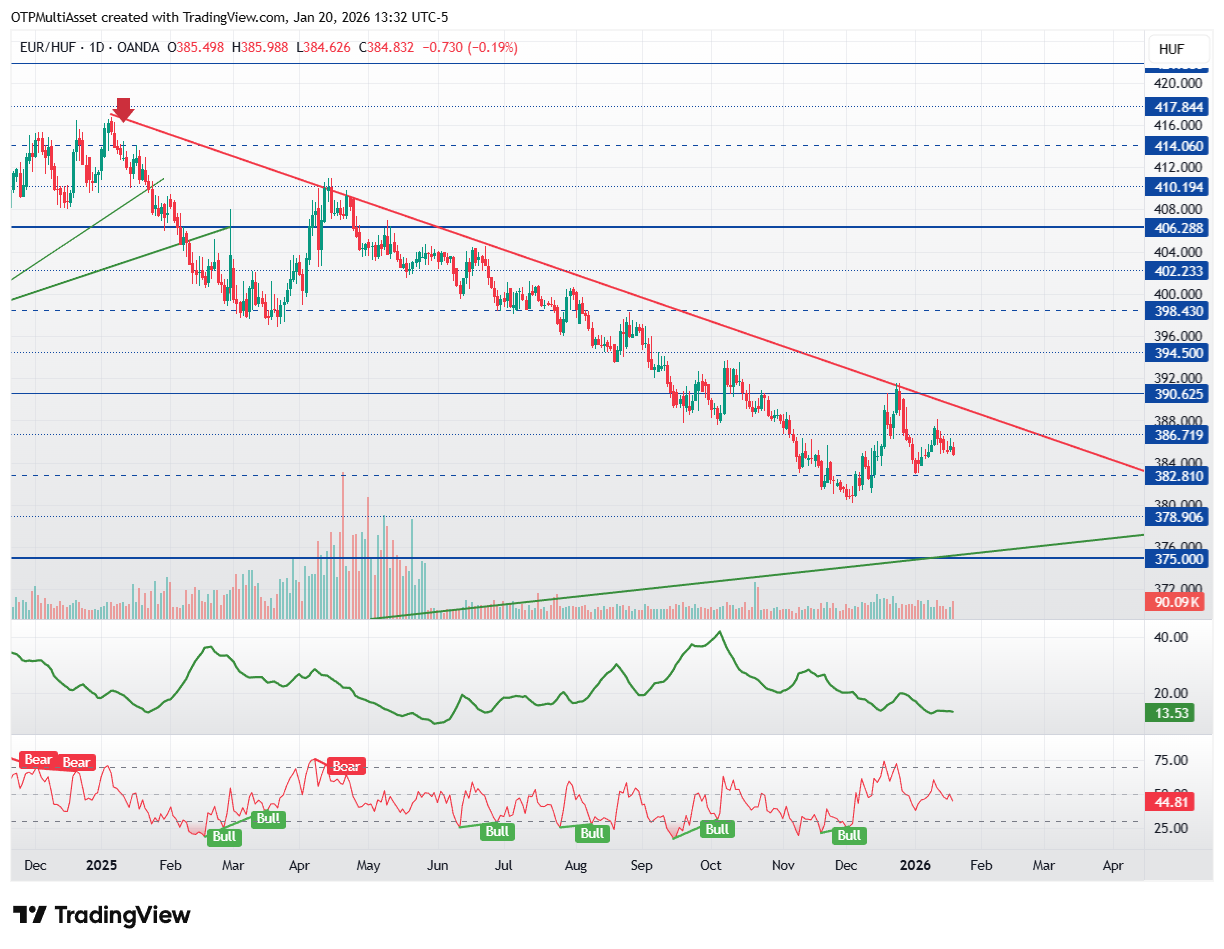
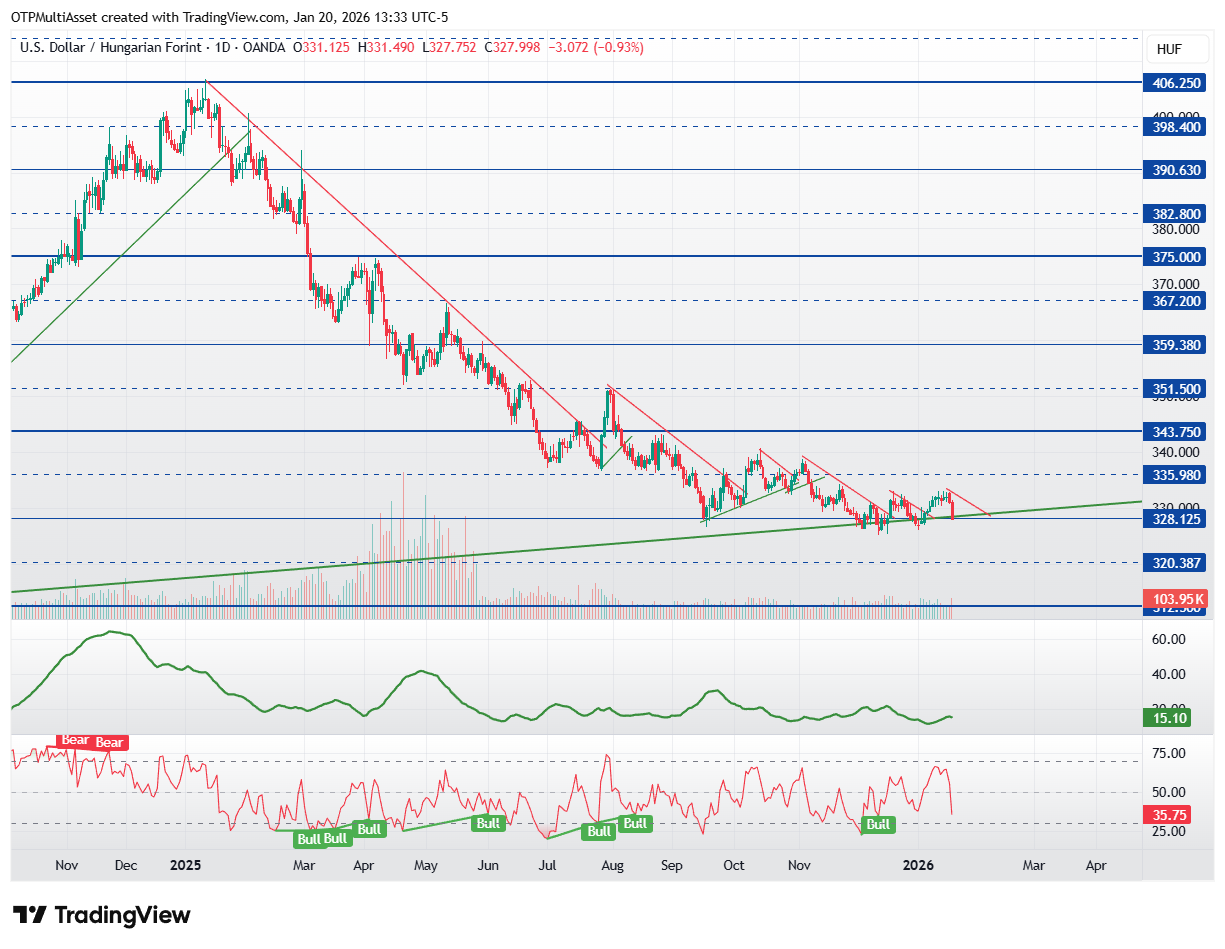
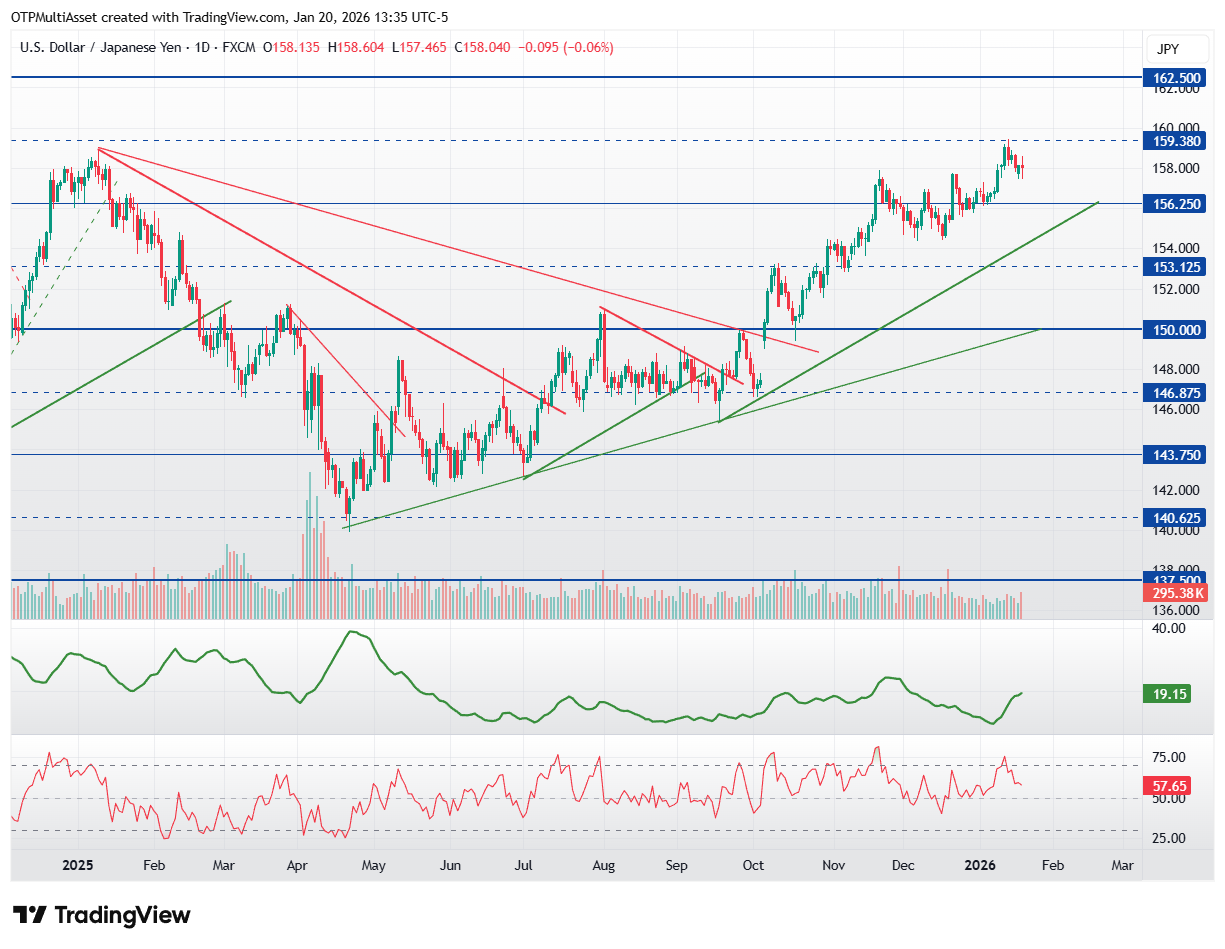
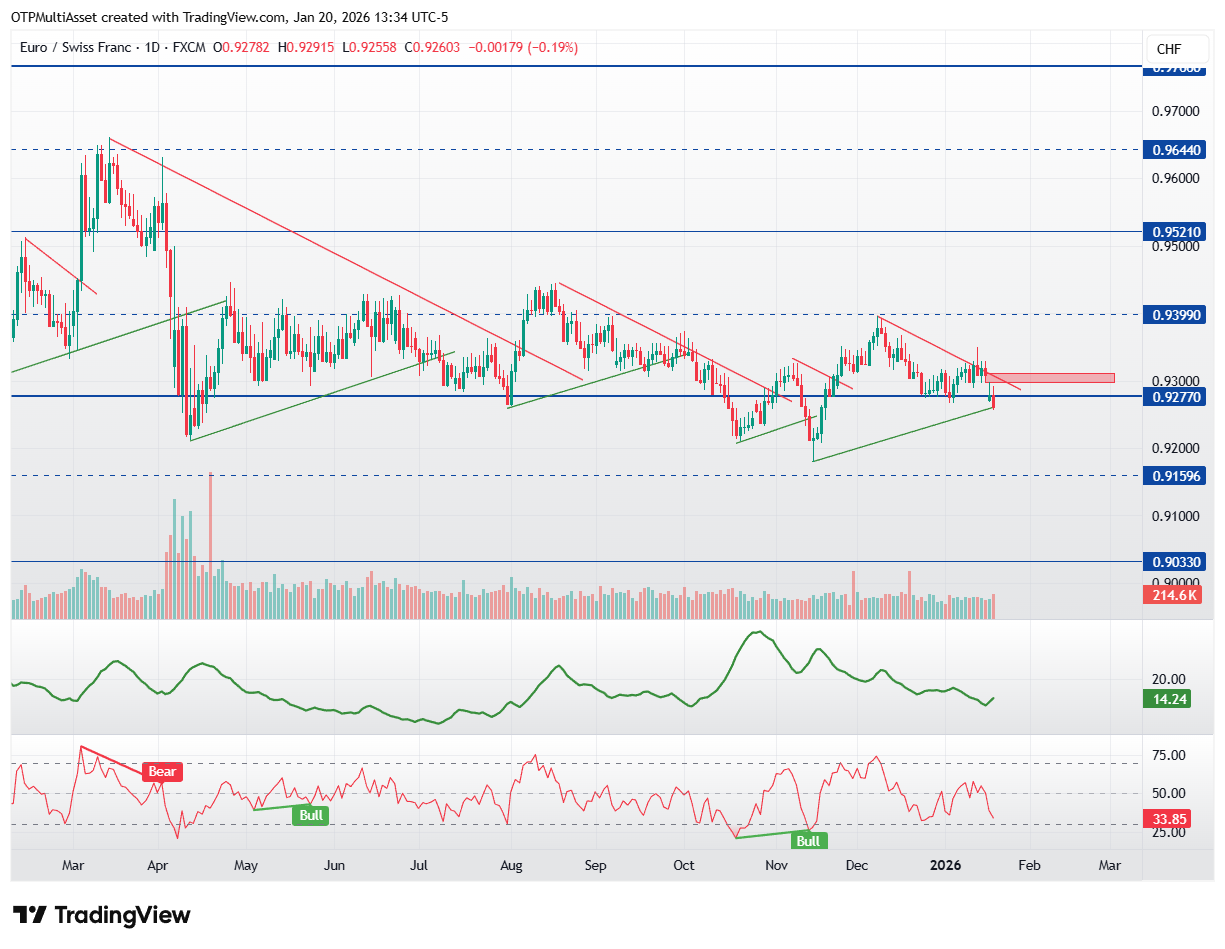
In the case of EUR/USD, we have seen a significant turnaround over the past two days. The breakout of the downward trend line and the sharp rebound may indicate the beginning of a trend-like weakening of the dollar. It may be worth looking for buying opportunities in pullbacks, with appropriate risk management, of course. GBP/USD has also returned to an upward trend due to the weakening of the dollar, but the momentum here is much more moderate than in EUR/USD. EUR/HUF continues to narrow below its main downward trend and has not given any signals yet. Downward, the 382.8 level provides support, while upward, the downward trend line limits movement. A break above the 390.6 level could bring a change in the current downward trend. USD/HUF has again fallen close to the 328.1 support level as a result of the weakening dollar. There are no buy signals for the time being, and based on the technical picture, there is even a risk of a later break, so it is worth waiting before opening long positions. The USD/JPY reached its target price of 159.38, so further upside potential is limited. The level around 156.25 could provide support, and the trend would also break at this point. EUR/CHF opened with a downward gap, which means that the natural support level of 0.9156 could once again be targeted.
EURUSD
EURUSD
A significant turnaround can be seen in the curve: Monday's large bullish candle broke through the downward trend, giving a clear long signal. This movement could open up significant upside potential – it is precisely this kind of strong rebound that could confirm expectations that a significant weakening of the dollar is also among the scenarios. In the event of a retest, the 1.1658 level could offer an ideal entry point for the long side. However, after such momentum, we cannot necessarily expect a deeper pullback; currently, the 1.1719 level can be considered support. If the exchange rate cannot close below this level, it also indicates further strength in the movement. In this case, a corrective trend line can help determine the entry point.
Due to the weakening of the dollar, it has returned to its upward trend. Closing below the thick green trend line could be problematic, but currently, it is more likely to attack the level around 1.3672.
Compared to the turbulent market environment, there has been virtually no significant change in the exchange rate assessment. The pair is still moving in a downward trend, but has already found support at the 382.8 level, while the red trend line represents the decisive resistance level. The curve is gradually narrowing, but so far there have been no signs of a significant turnaround. The technical picture is still not clear enough to give a reliable buy signal; the market currently lacks confirmation of a turnaround. The 390.6 level can be considered a watershed between the long and short directions: moving above this level would indicate a structural change and a break in the trend. A reversal signal is therefore still awaited. If the price breaks down from the narrowing structure, the 375 level would serve as strong support.
Due to the strength of the dollar, the exchange rate is back around 328. Even if this level breaks, 324.3 or 320.4 could be possible in the short term. The bigger picture has not yet turned upward. It is currently advisable to wait and see, because if the exchange rate remains stuck for too long, a sustained decline may occur due to the weakening of the dollar. Until then, 335.98 and 343.75 remain strong resistance levels.
Resistance levels: 343.75; 351.5; 359.38. Support levels: 324.3; 320.4; 312.5.
USDJPY
USDJPY
The upward trend essentially reached the next level at 159.38, from which a minor correction followed. However, the curve pattern does not yet indicate a reversal, but since the calculated value was reached, further long positions do not seem to be a good solution. The upward trend may break at 156.25 in a few weeks.
Resistance levels: 159.38; 162.5. Support levels: 153.13; 151.5; 150.
EURCHF
EURCHF
At the beginning of the week, it started to decline, which has not yet been filled. This is a rare phenomenon in currencies, which can only occur at the beginning of a new week, so it represents a significant decisive level. The 0.93 level thus became a strong resistance, and a decline began, which may target the 0.9156 support. It may be worth following the red trend line; as long as it remains below it, a reversal is unlikely.
Resistance levels: 0.9399; 0.9521; 0.9644. Support levels: 0,9160; 0,9033.
Get more out of your investments!
Global Markets Services
OTP Global Markets offers a broad range of services in the field of local and international money and capital markets.